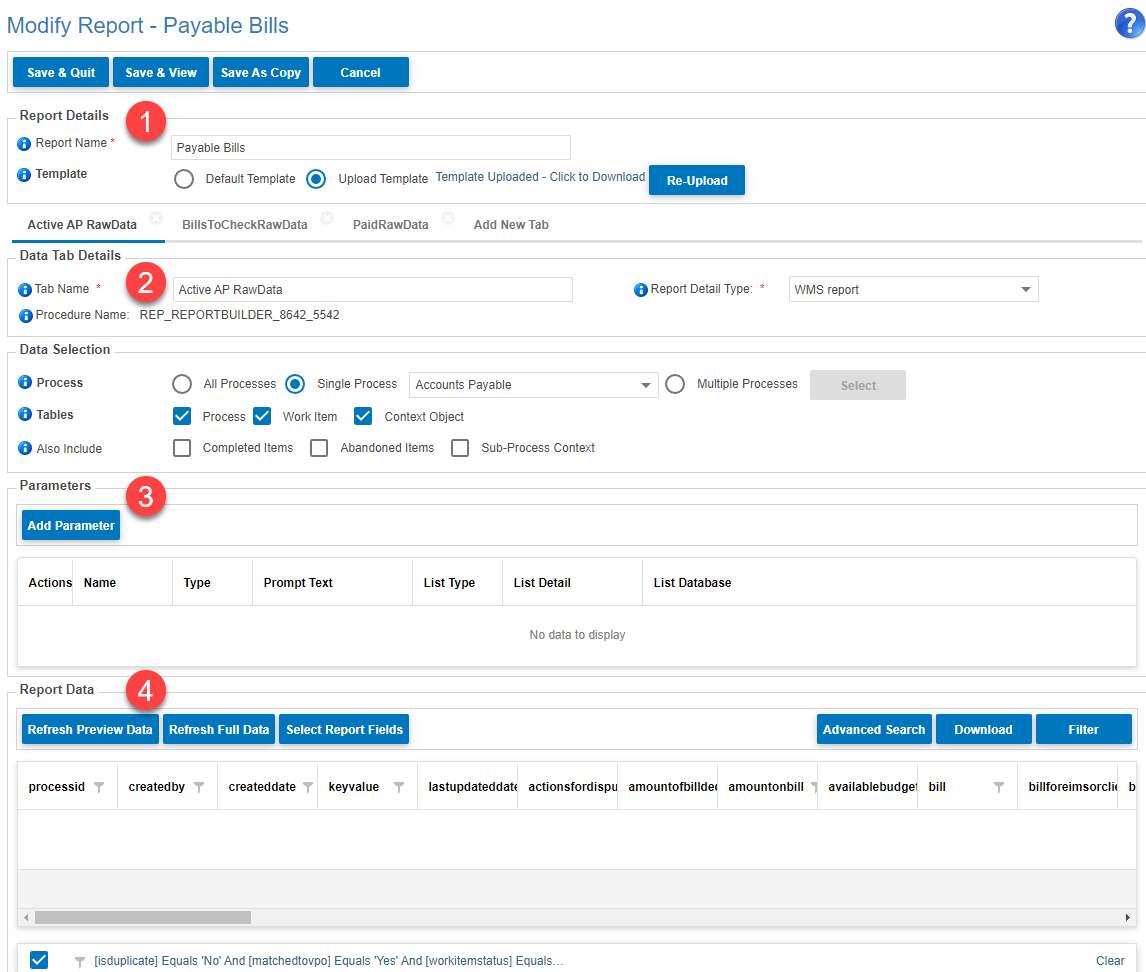
menu

WebPlatform Documentation

Create a Report - Reporting Builder Training

download

Create a Report

Start with the fundamental: Know your purpose.

If you do not have a clear understanding of a) why you need the report and b) what it needs to deliver, then you should not attempt to create a report. You're wasting time!

Before you create a report you must know what your data source is and how the data must be presented to it's intended audience.

Do your homework - find out if all the information you need to show exists in the source and make sure you have a dummy report you have signed off with the report owner so that you know what you must deliver.

This might seem basic to you, but you'll be surprised at the number of times someone has told you 'I need a new report!' & 'I need this new report ASAP!' yet they have no idea what it is that this new report needs to show once you start qualifying the need... Hence the comment above...You're wasting time!

So please, please do not build unnecessary and useless reports.

We have prepared training for report builder. Your learning journey begins now:

In order to achieve… we must…

Context for this training: What we want to do

  • Train users so that they can create on demand reports using Report Builder for processes that have been designed
    • Report Builder is the tool we use to build SQL2XLSX reports
  • Learn how to set up templates for on demand reports
    • Take what we are familiar with in excel and turn it into a macro enabled template that will work for any user at the click of a button!
  • This training will also enable users (especially designers) to take on tasks to create reports for other processes or to work across WebPlatform's

Context for this training: What we have done

What we need to know: WMS Designer / Reporting Best practice

  • Before we go ahead and design a process we should make sure that what we are about to capture meets the reporting needs - reporting and process design are intrinsically linked
    • Great idea is to always ask the requestor how their report will look like…it's also best practise!
    • Have a dummy of the expected report so that expectations are always met!
      • Always check brand guidelines for each client
    • The existence of a dummy report will allow you to check the following:
      • Am I capturing all of the data I will need to report on?
        • The first step in creating a usable product is understanding those goals in the context of the user’s environment, task or work flow, and letting these needs inform the design
      • Knowing what needs to be reportable drives which fields / context objects you need to set up in the design or must exist already….
        • Context objects are data fields within a process and the answers to these give us data for reports!
          • Context objects are answered by users in the process forms
  • No one should create a report for a process without first familiarising themselves with the processes that will be used for raw data – Know your fields/ context objects!

What we need to know: Specific for Custom SQL reports

  • These were the old ct.com reports….
  • All of these reports have been migrated to the EIMS WebPlatform
  • If you need to change (further customise) any these reports:
    • Submit a user story with the business case (= Why should EIMS invest in this change?) to Samuel Hardy so that he can review and prepare an EIMS Development Request if appropriate

In a WebPlatform we work ‘backwards’ to set things up…from foundation to end product!

Here's the journey to follow when building a report.

Why do we need the Reporting Module?

  • Our clients map out their business processes and cut these processes live for users to follow
    • They need to be able to report themselves on the Process & WorkItems through a report building tool
    • They also need a place where they can request and view reports for their processes
  • Location for Reporting Module in the foyer

What you already know about Reporting

  • Report Catalogue: This is where users can see which on demand reports* they have access to & can run these
  • View Report
    • You can run and/or schedule a report
    • If the report has parameters you will be able to select based on your requirements
    • Format: default = Microsoft Excel 2007
  • The report will be queued and once generated it will be visible in 2 locations:
    • In your inbox
      • Click on the link to download the report
    • In 'My Reports'
      • Click report name in 'Download Report' column

* An on demand report runs at the click of a button (as and when needed) & does not require users to refresh data or fiddle with the report 

  • Report Catalogue: This is where users can see which on demand reports* they have access to & can run these
    • Schedule a Report
      • You can set up frequency and time to run
      • You can also select a date for the schedule to expire on
      • You can select additional users to receive the scheduled report (add and maintain the list of additional users)
      • Add new schedules
      • Update and change a schedule
      • See all scheduled reports in ‘My Scheduled Reports’ tab
  • My Reports
    • Where you can see all of the reports you have requested & are scheduled for you to receive
    • Download reports

Now that we’ve covered what you know, let’s learn something new!


Report Builder

  • Report Builder is the tool we use to build SQL2XL reports

Steps involved in creating an on demand report

Best Practice outlined

You can create new custom reports

  • You'll have a blank canvas to work on 
    • Report name is empty
    • No template exists
    • Tab Name is empty
    • No process is selected by default
    • No fields are selected by default
    • No parameters are applied
    • Report data is empty

You can modify reports owned by yourself

Only the user who created a report can modify it (will see the ‘Modify Report’ button)

    • Rename the report
    • Change the selections for your report
      • Processes
      • Tables
      • Options
      • Fields
      • Parameters
      • Pre-Filters etc
    • Upload a template, download current template
    • Upload a modified template

Actions you can take with a report

  • Save & Quit – will take you back to the Reporting page
  • Save & View Report – will allow you to run and test your report
  • Save As Copy – a copy of your report will be created, Report name will be blank
  • Cancel – will not save any changes you have made & take you back to the Reporting page

Steps involved in creating an on demand report

Best Practice outlined

To create a custom report…

  • In Report catalogue, click New Custom Report. The “Create Report – My New Report” page loads
  • There are 4 sections:
  • 1. Report Details
    • Name your report
    • Upload the template for your report
      • Best practice is to upload a template only when you are satisfied the raw data you’re extracting meets your needs and you have the end product tested and ready = what you want users to download
      • Last thing you do for your (new) report
  • 2. Data Tab Details
    • Where you can select the source(s) for the data, tables and what to include
  • 3. Parameters
    • Apply run time filters to run the report using fields in the selected process(es)
  • 4. Report Data
    • Where you can select the fields / context objects you want to use for the report
    • Where you can refresh data and see what each tab will pull after selecting the fields / context objects 
      • you can select to preview data, or see full data
    • Where you can apply filters to the data (extract only what you actually need)
      • in effect this is a pre-filter on data that can be extracted using this report 

Custom report: What you need to know…

  • 1. Add Report Name

    • This is what the users will see in the Report Catalogue
    • Make sure it is relevant & can be easily searched for
  • 2. Upload a Template Leave for later (end)

  • 3. Give your Tab a Name

    • This will be the name of the worksheet that contains the raw data
    • Important to be relevant to the data within
    • Is referenced in all VLOOKUP formulae you might apply to your report template 
  • 4. In the Data Selection section select the relevant option for Selected Processes

    • All Processes (You should expect a very large volume of data….)
    • Selected Process (Choose one from the list)
    • Custom Selection, click Select
      • Custom Process Selection pop up will load with options: Department OR List of Processes
      • Your output will either be for all processes within the selected Department OR
      • Your output will relate to a number of selected processes
  • 5. Select Included Tables from:

    • Process (1 row of data per process)
    • Work Item (1 row per WorkItem in the process, identifying status & type)
    • Context Object
      • Only available if you have a selected ‘Process’ too, gives you 1 row of data per process with a column for each context object
      • When selected, ‘Select Report Fields’ will load
      • The pop up grid shows 2 columns:
        • Process Fields, WorkItem Fields, selected Process(es) Context Fields
        • Selected Fields
      • Select Fields you want to export in the raw data (maximum 300) & click Apply
        • Best practice: Only select what you need!

What each column contains & how to apply your selected fields / context objects :

  • Process Fields : contains System fields
  • WorkItem Fields : lists names of WorkItems in selected process(es)
  • All Processes – Context Fields : list of fields / context objects that exist in process(es) which were selected for the report
  • Count of selected Fields / Context Objects is visible
  • Click Apply once the required Fields /Context Objects are selected
  • Selected Fields / Context Objects are visible in Selected Fields column
    • you can order fields as needed
  • 6. Data to Also Include

    • Completed Items (very useful as you do not necessarily only want to extract data for active processes)
    • Abandoned Items (your report will pull processes which have been abandoned)
      • Process Status = ABORTED
      • Two columns will be added to your report:
        • Abandon Reason
        • Abandon Date
    • Sub-Processes (allows extracting data from sub-processes)
help_outline
close