menu

WebPlatform Documentation

How to create a new report

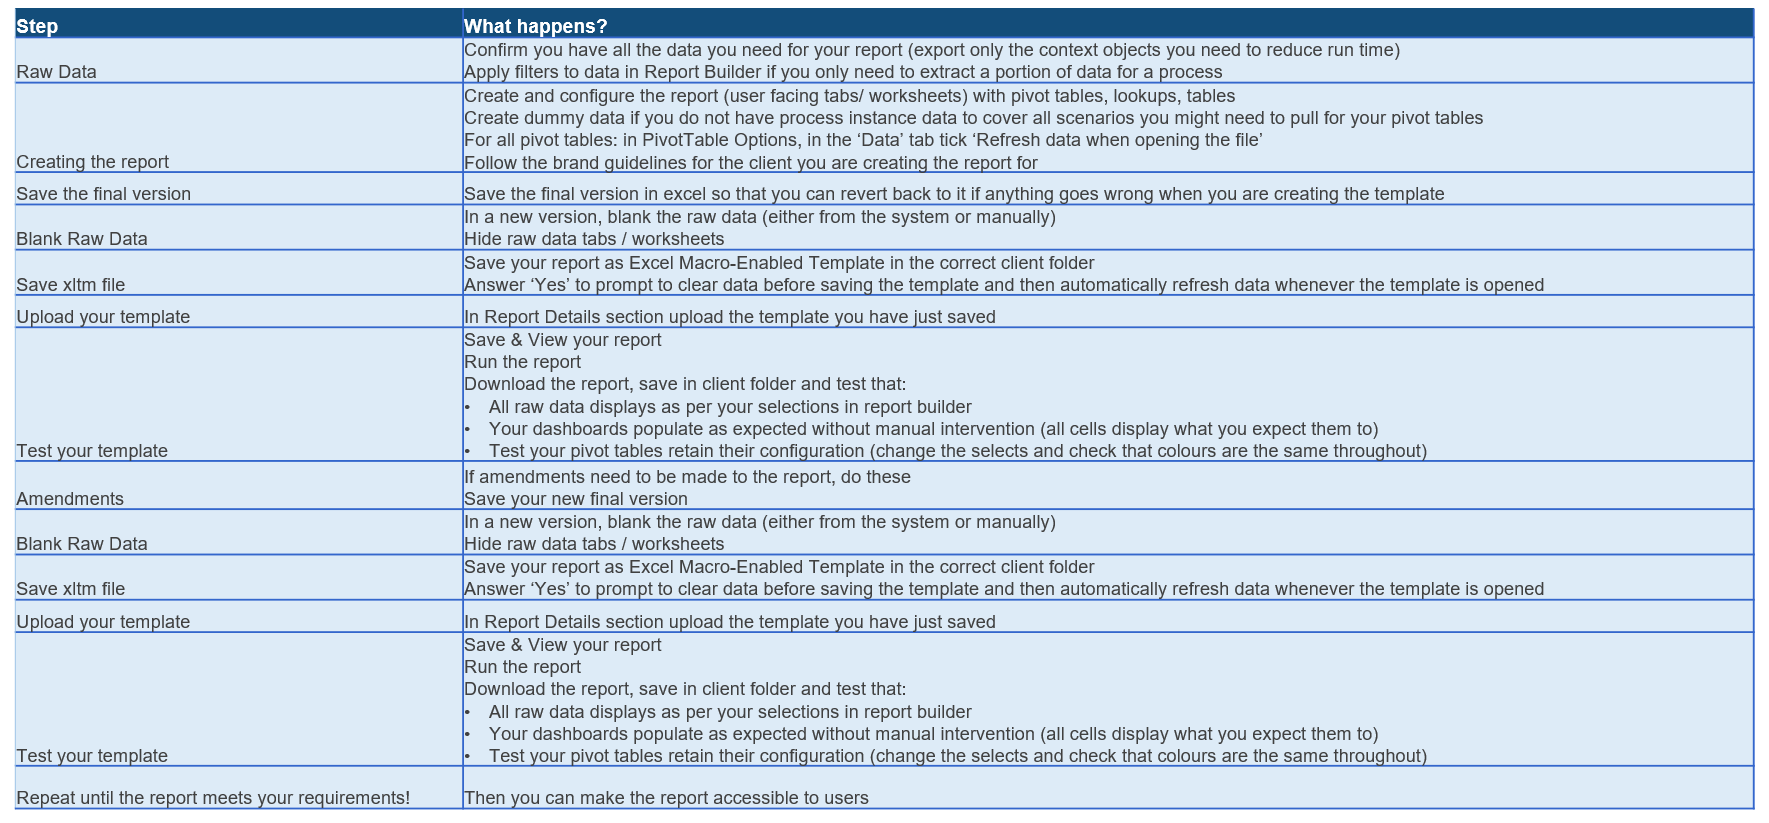
Steps involved in creating an on demand report - Best Practice Outlined

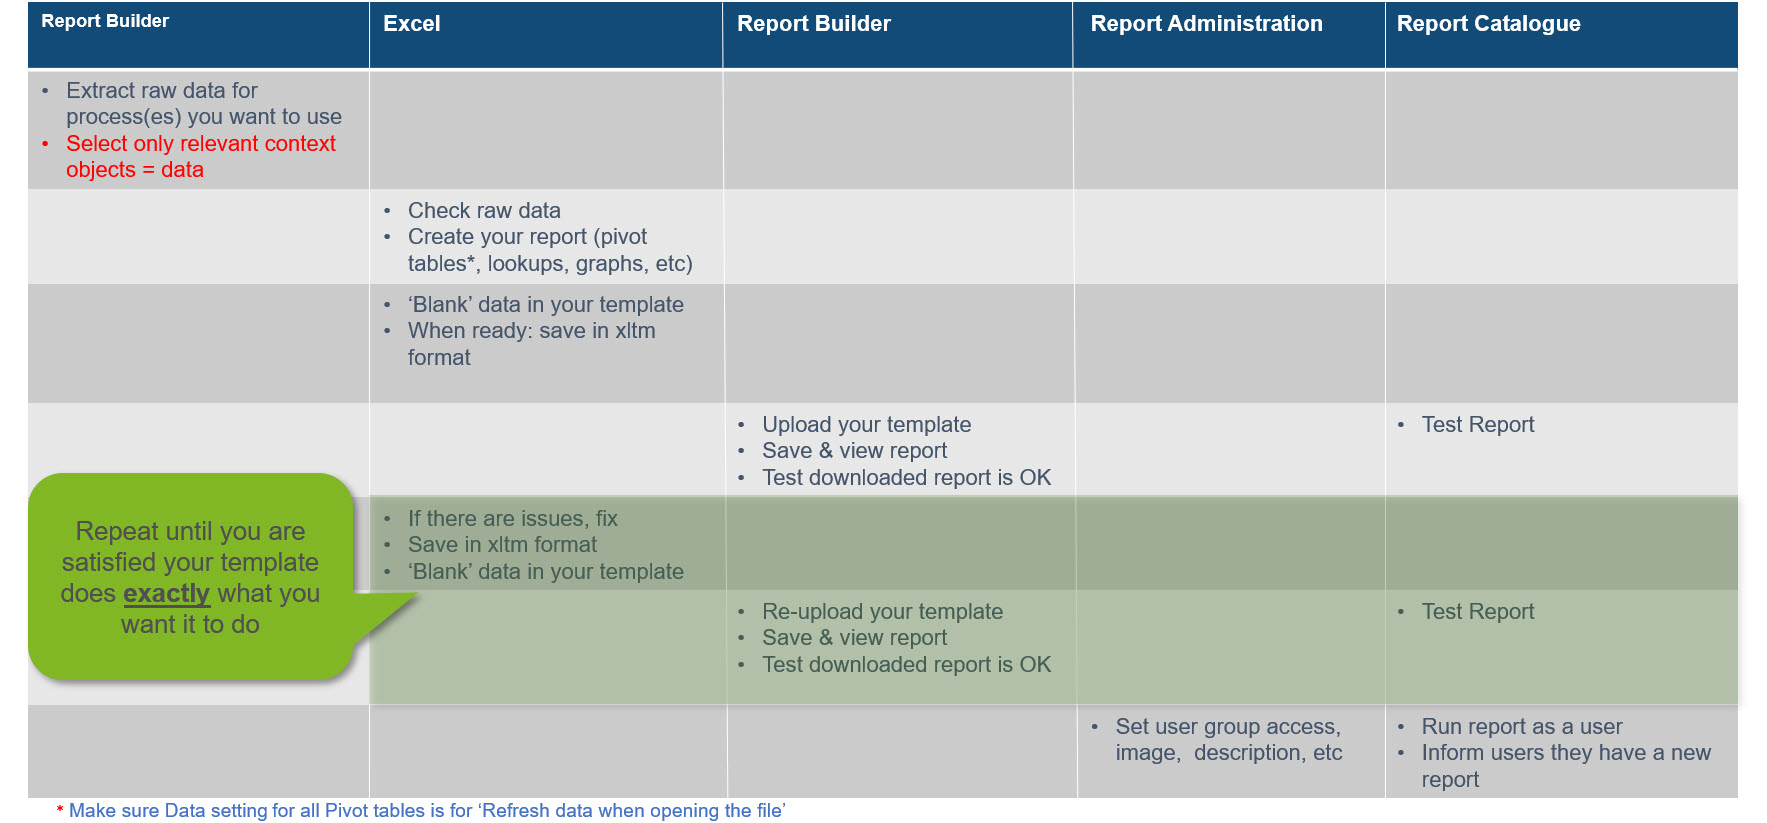
What we need to do to create a report: Best Practice Milestones

Let’s start with access to Report Builder

If you have permission to use this application, you will see:

  • Report Builder is the tool we use to build SQL2XL reports
    • You can create new reports
      • Depending on your roles in the WebPlatform, you will be able to create a WMS Report or a Custom SQL Report. If you only have access to one type of report, the page will automatically load the setup for that report
        • In this example the user only has access to create a WMS Report
  • You can modify reports owned by yourself
    • Note: Only the user who created a report can modify it (will see the ‘Modify Report’ button)
    • Change the selections for your report
      • Processes
      • Tables
      • Options
        • Filters etc
    • Upload a template, download current template
    • Upload a modified template
  • Actions you can take with a report:
    • Save & Quit – will take you back to the Reporting page
    • Save & View Report – will allow you to run and test your report
    • Save As Copy – a copy of your report will be created, Report name will be blank
    • Cancel – will not save any changes you have made & take you back to the Reporting page

To create a new report...

  • In Report catalogue, click New Report. The “Create Report – My New Report” page loads
  • There are 4 sections:
    • Report Details
      • Name your report
      • Upload the template for your report
        • Best practice is to upload a template only when you are satisfied the raw data you’re extracting meets your needs and you have the end product tested and ready = what you want users to download
        • Last thing you do for your new report
    • Data Tab Details
      • Where you can select the source(s) for the data, tables and what to include
      • Depending on the security permissions which are assigned to you on the WebPlatform you can create a report tab as a WMS report or Custom SQL Report. The type of report tab can be selected in the Report Detail Type dropdown
        • If you only have one permission for the report type, this will be automatically selected when you create a new report
    • Parameters
    • Report Data
      • Where you can refresh data and see what each tab will pull
      • Where you can apply filters to the data (extract only what you actually need)

What you need to know...

  • Add Report Name
    • This is what the users will see in the Report Catalogue
    • Make sure it is relevant & can be easily searched for
  • Upload a Template Leave for later (end)
  • Give your Tab a Name
    • This will be the name of the worksheet that contains the raw data
  • In the Data Selection section select the relevant option for Selected Processes
    • All Processes (You should expect a very large volume of data….)
    • Single Process (Choose one from the list)
    • Multiple Processes, click Select
      • Multiple Processes pop up will load with options: Department OR List of Processes
      • Your output will either be for all processes within the selected Department OR
      • Your output will relate to a number of selected processes
  • Select Included Tables from:
    • Process (1 row of data per process)
    • Work Item (1 row per WorkItem in the process, identifying status & type)
    • Context Object
      • Only available if you have a selected ‘Process’, gives you 1 row of data per process with a column for each context object
      • To include Context Objects in your report click on Select Report Fields in Report Data
      • The pop up grid shows the process fields and the Context Objects which exist in processes
      • Select Context Objects you want to export in the raw data
      • Best practice: Only select what you need!
      • Process Name is the process the Context Object originates from, and can display as:
        • All Processes – Context Object exists in all processes which were selected for the report
        • Multiple processes – Context Object exists in more than one of the selected processes
        • Unique process name - Context Object only appears in that single process
      • Context Object Name is the Context Object name for the Process
      • You can create groups for your report fields by clicking Add new group
      • Click Apply and close the dialog box once the required Context Objects are selected
  • Data to Include:
    • Completed Items (very useful as you do not necessarily only want to extract data for active processes)
    • Abandoned Items (your report will pull processes which have been abandoned)
      • Process Status = ABORTED
        • The date abandoned will also be included in the report
    • Sub-Processes (allows extracting data from sub-processes)
  • Parameters covered later
  • Once you have selected all options you want to use for the raw data you can Refresh Data to generate
    • Refresh Full Data = All data generated post refresh will be for the selected process(es) only
    • Refresh Preview Data (loads only 100 rows of data)
    • Apply filters to reduce amount of data generated
    • Change order of columns
    • If you are exporting 300 fields, expect to wait a while to generate the data!
      • This also means that when your report is requested by users it will take long to run!
  • Download the raw data
    • Export will appear at the bottom of the page
    • Open/click to view data to make sure you have what you need
  • Click Save & View Report – Always test your reports!

To modify a report...

  • In Report Catalogue, find the report you want to modify
  • Click Modify Report
    • You will be taken to the set up page of the report
    • You can see the Procedure Name (stored procedure system has created for your report)
    • Add your modifications e.g.
      • Add more tabs
      • Change Included Tables
      • Change or add a Template
        • Format: xltm
    • Refresh Data
      • Allows you to see the data for your report in the grid
    • Click Save & View Report
      • Run and open the report to check:
        • all of your modifications have been applied
        • the report does not error
  • In Report Builder you can also save a copy of a report
    • You can then work on it independently (not break anything that already works. Great to use as a sandbox!)

Note:  If you are not using a template, at this point all you have is a raw data dump for the selected process(es)

Testing Output

  • Testing: Run the report
    • See Report History (average time to run)
    • Check that it generates without error
  • Download or open from your Outlook
  • Check the raw data matches your Custom Report settings
    • Correct Tab Name(s)
    • Data for correct Process(es)
    • All Context Objects exported
      • Based on report settings
    • First Note and/or Most Recent Note exported
      • Based on report settings

Visibility of a Report

Note: Reports are only visible to the creator until published to others. To publish your report to others:

  • In Report Administration/Management, select/edit your report
  • In Report Detail, select Category, add Description, add report image & upload, select Report Group(s) & Save
  • Check that your report is visible to the right users
    • Selectable in Report Groups

Exercise 1: Create a Basic Report

Exercise 1: Basic Report with 2 Tables for Process: Holiday Request

  • Click on New Report
  • Replicate the settings in the screenshot
  • Report Name: ‘xx=Your Initials’ Basic Report Ex1-Holiday Request
  • Save & View Report, run & check output
    • It will be a simple raw data dump

Exercise 2: Create a basic report with 2 tabs and different tables

Exercise 2: Basic Report: with a 2 tabs. Tab 1 - A selected list of context objects for one chosen process and WorkItem Tables included

  • Click New Report
  • Report name: ‘xx=Your Initials’ Report Ex2 – 2 Tabs
  • Tab 1 set up:
    • Add Tab Name
    • Selected Process = New Campaign Set Up
    • Included Tables = Process & Context Object
    • Data to Include = Completed Items
    • Click Select Context Objects
      • Note: There are 56* Context objects.
    • Do you need all of these? Let’s only select the context objects we need. For the purpose of this exercise select ~10 context objects
      • Click OK once context objects are selected
  • Click Refresh Data
  • Download (this is to check that the context objects match your selection)
    • In the gif there are 12 selected CO’s
  • Click Add New Tab
  • Tab 2 set up:
    • Add Tab Name
    • Single Process = PSO Request
    • Tables = Process & Work Item
    • Also Include = Completed Items
  • Save & View report
  • Check the output to make sure it matches the report set up!
    • For WorkItem data there should be one row per name(=WorkItem in the process)
    • There should be multiple rows of data for each Process ID

* Exporting too many context objects will slow down any report

Exercise 3: Create a basic report & template & make it accessible to users

Exercise 3: Basic Report with 3 Tables for Process: Holiday Request

  • Run & Download existing Holiday Request Report (so that you have an xlsm doc)
  • Take a copy of the report created in exercise 1
  • Replicate the settings in the screenshot
    • Report Name: ‘xx=Your Initials’ Basic Report Ex3-Holiday Request
  • Change column order (as in current report)
    • Move WorkItem ID column to beginning of the report data grid
  • Save & View Report, run & check output

Exercise 3: Template

Replacing raw data & Template testing

  • As a test, exchange the raw data with the one you generated
    • Paste your raw data into the ‘EISSRawData’ tab/worksheet
    • Test the pivot tables & source cells
      • In raw data, find ‘fromdate’ column header & note column number
      • In raw data, find ‘todate’ column header & note column number
      • Update formula in ‘HolidayRequests’ tab/worksheet
      • For all pivot tables, in PivotTable Options, in the ‘Data’ tab tick ‘Refresh data when opening the file’
  • When you are happy that your raw data works for this report we can move to the next step: creating the template for your report

Template set up: Blanking all raw data

  • Blank the raw data: Why do we do this?
    • If we do not remove the data we used to create the template, every time a user downloads the report it will carry the original data!
  • There are 2 ways of getting blank data sheets for your report:
    • directly from Report Builder
    • manual creation for highly customised raw data headers

1.If you are getting your raw data headers directly from Report Builder:

  • Find your report, Click Modify Report
  • Under Report data ,Click Download
  • Copy all columns - only columns not the entire worksheet selection
  • Paste into your template
  • Repeat this process for all raw data tabs

2.If you have highly customised raw data then follow this process:
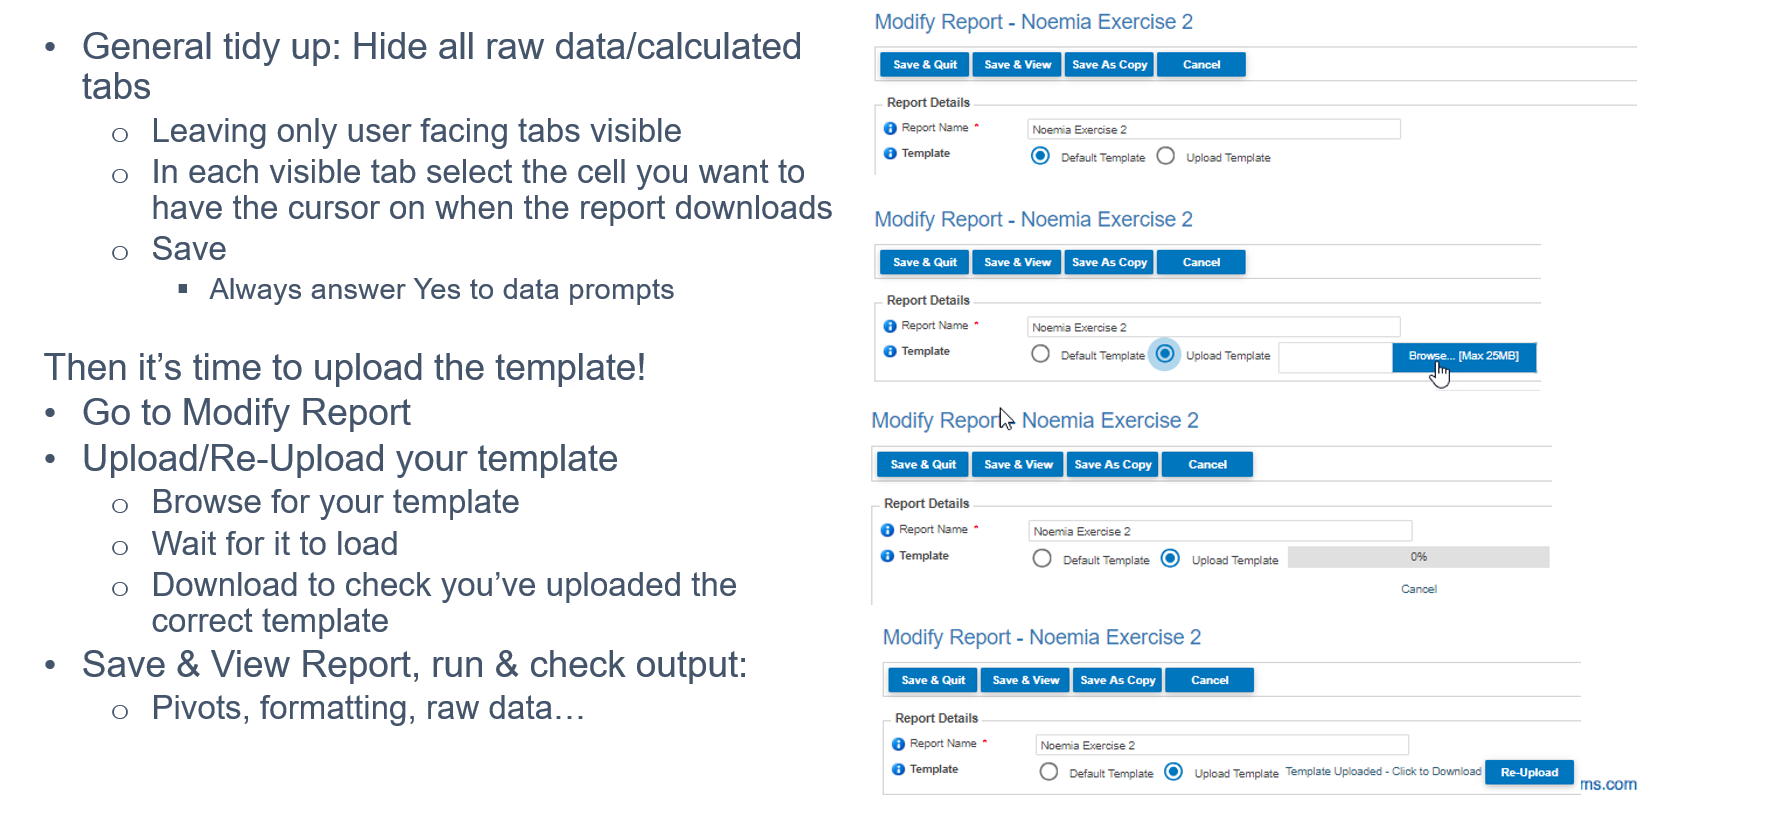
  • Open a blank excel document
    • We will use this document to create the tabs we need for the template (which will contain no data)
  • For the tabs where you have raw data:
    • Copy the header row into a blank worksheet in your blank excel document
    • Then copy all populated columns – only columns not the entire worksheet selection
    • Paste into your template
  • Repeat this process for all raw data tabs

General tidy up & template upload

Recap: Checklist for template set up

Exercise 4: Make report accessible to users

To finish off:

  • Go to Report Admin
  • Select Report Management
  • Find your report
    • Click on the Edit action icon
    • Your ‘Report Detail’ page will load
    • Select a category
    • Add a description
      • This is what the user will read in the info icon in the report catalogue
    • Upload an image for the report
    • Click Upload
    • Select report Groups
    • Save
  • Check that your report is visible to the user group(s) you selected with the image you uploaded
  • Request and download the report
  • Inform user group(s) they have a new report (as this is an exercise we will not do this) – we’ll skip this step during training

Report Builder Parameters

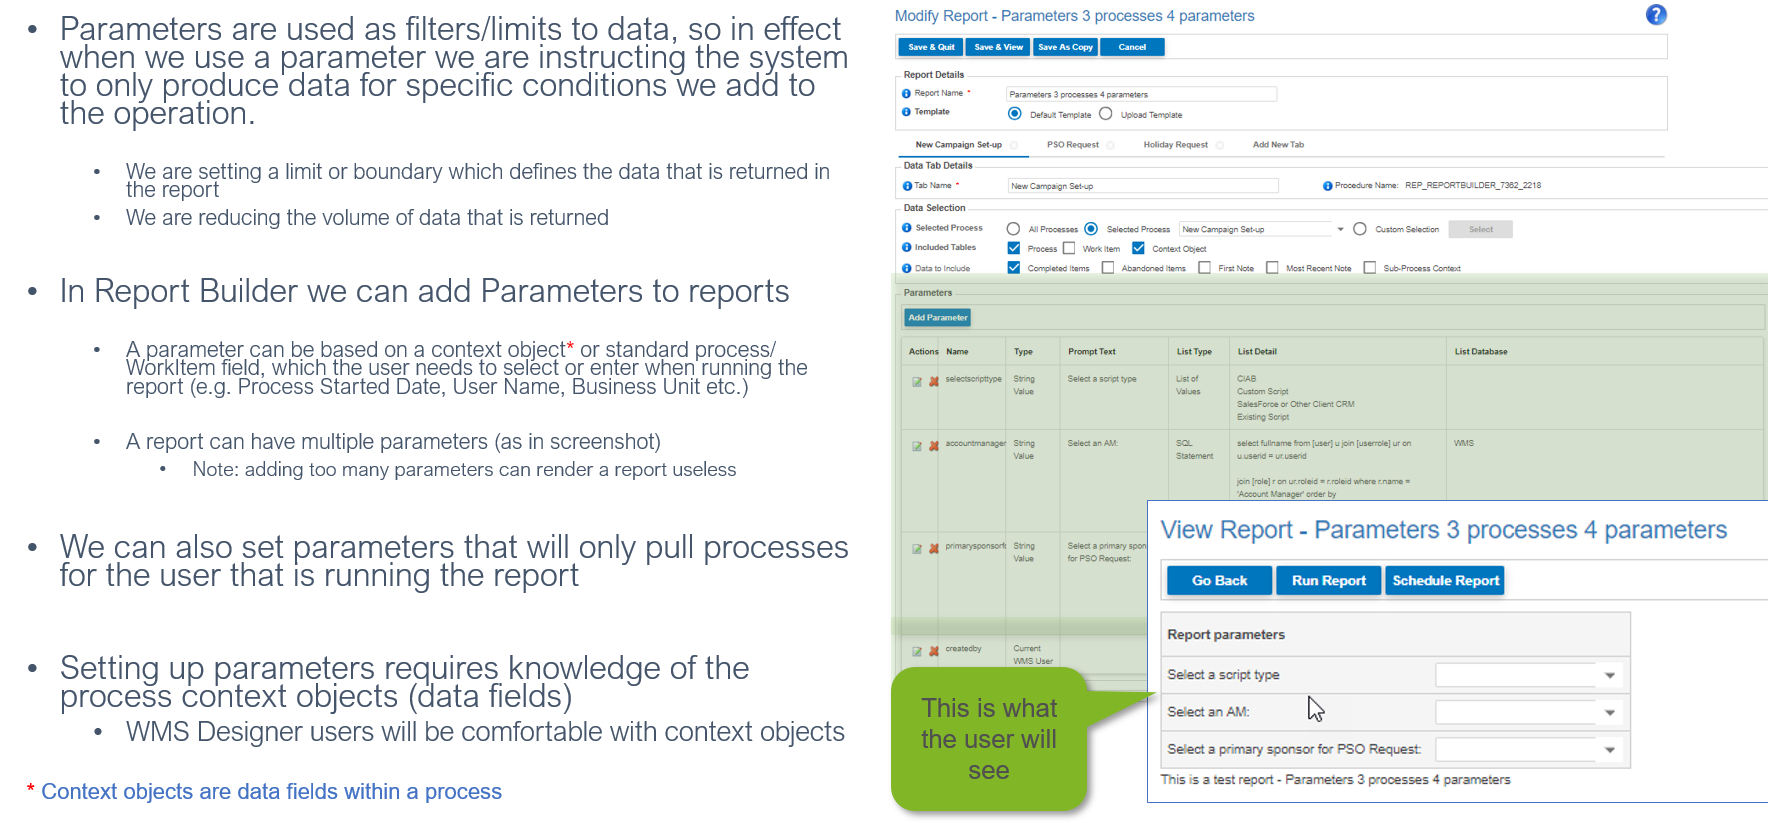
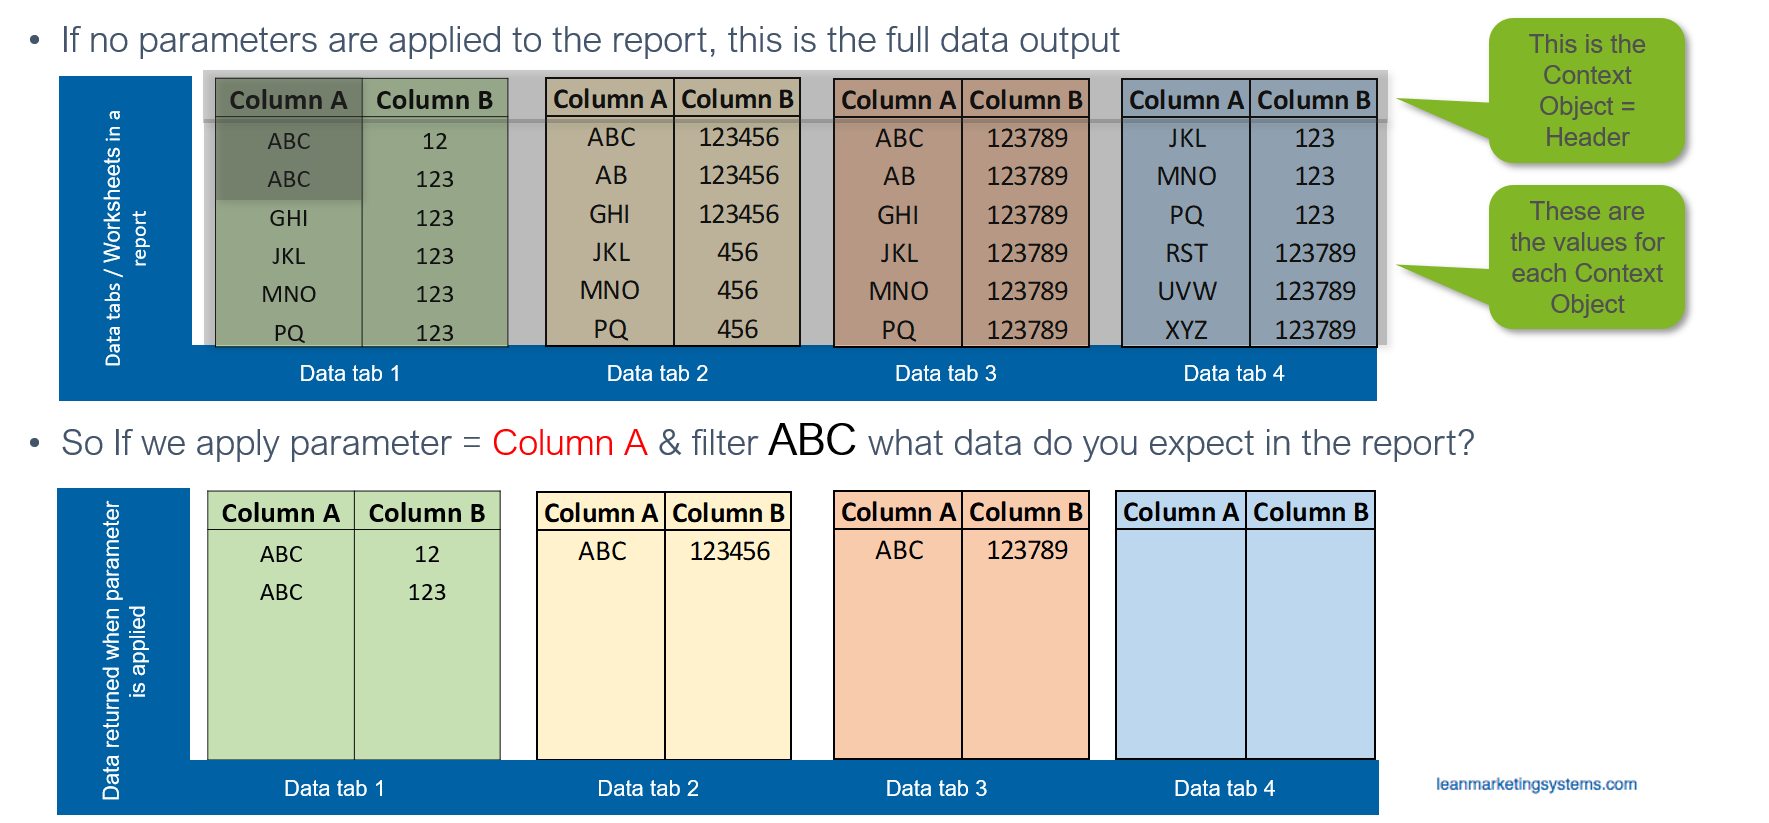
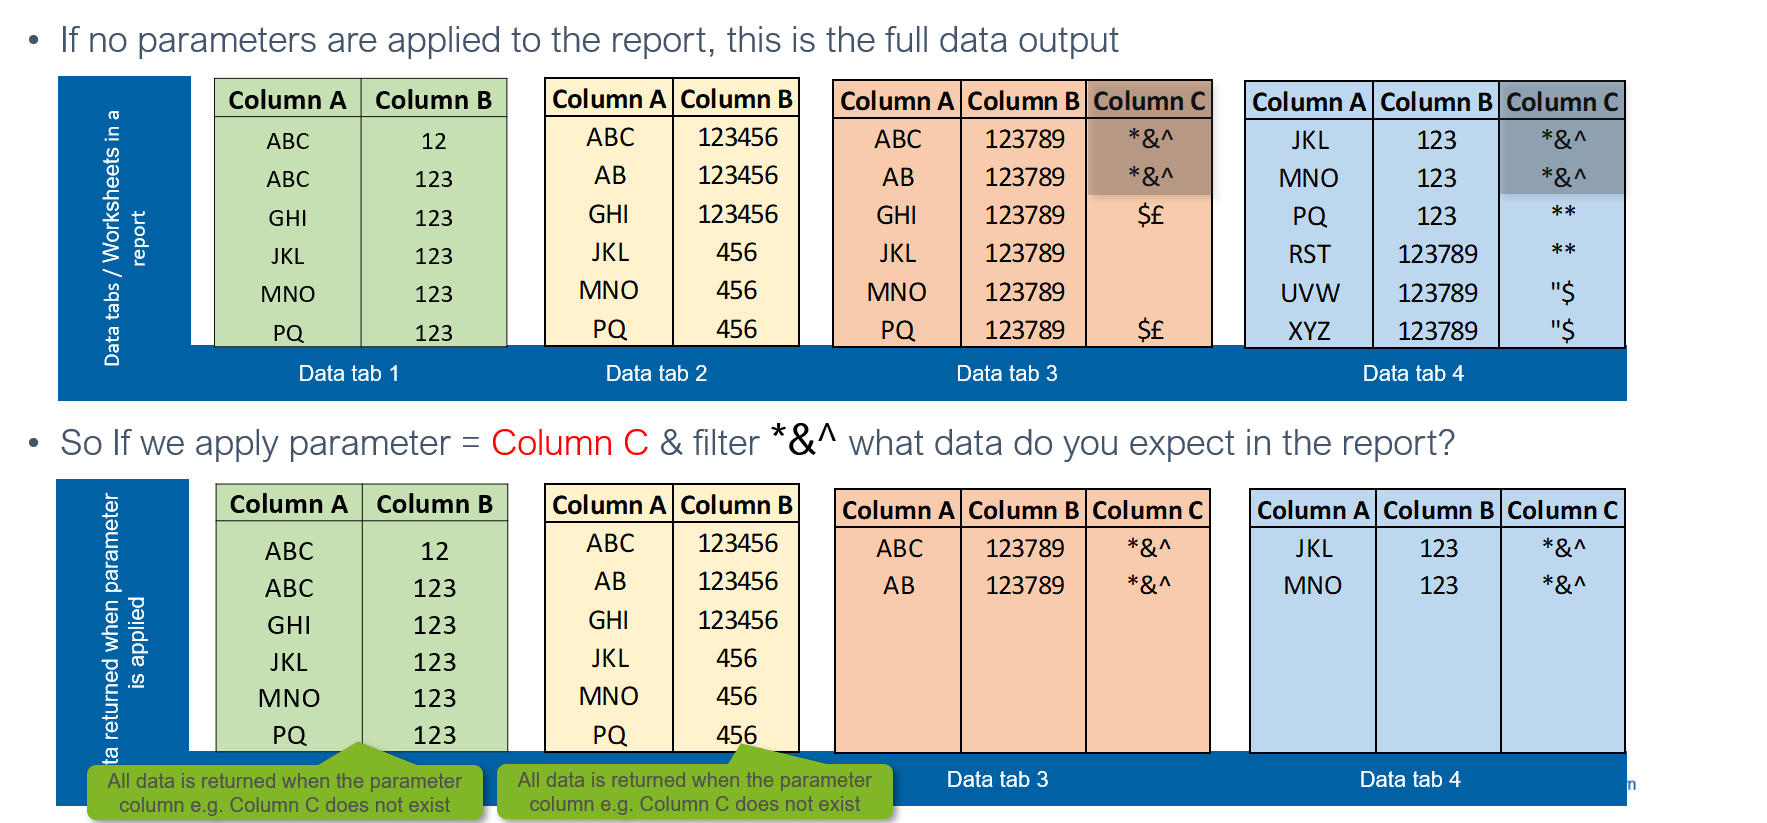
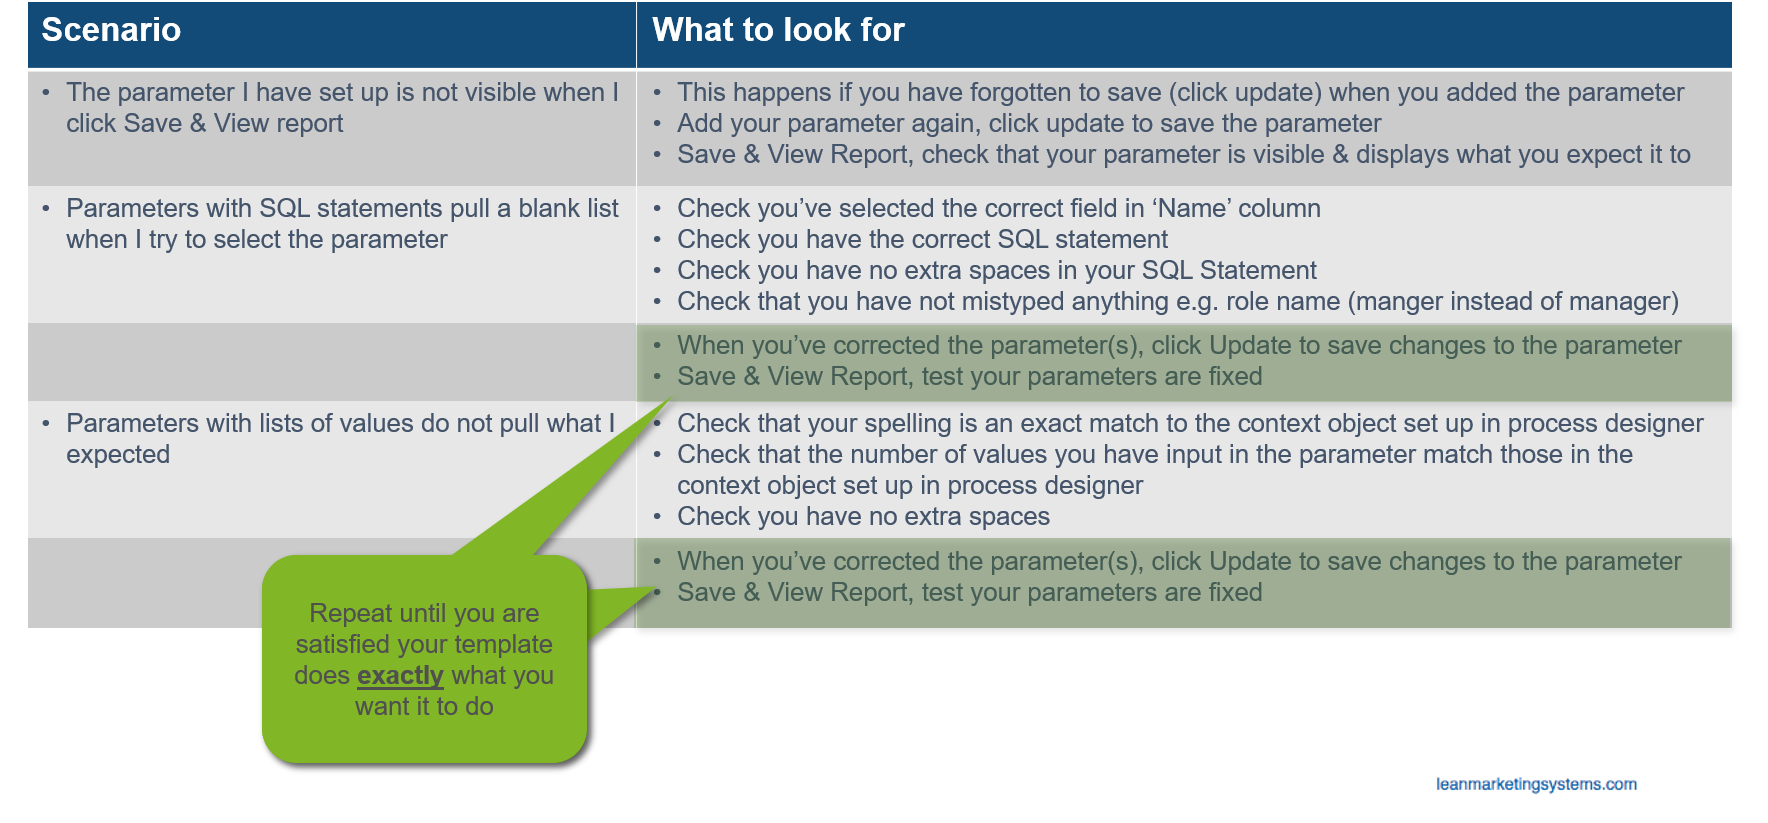
Why do we need / use parameters?

In practice - How are parameters applied to data?

How to set up a parameter for your report

Save your parameter

Multiple Parameters

  • All you need to do is click Add Parameter again
    • Set up the parameter(s) you want
  • The parameters display across tabs as they apply to all processes used in the report set up
    • E.g. The Current WMS User parameter will apply in the tabs where the field exists
  • Note: It’s quite important that the user setting up the report is familiar with the data so that by introducing parameters to a report, these do not render it useless.

My Reports

  • In My Reports users will see
    • parameter for the report
    • selected option
  • Format:
    • parameter – option selected

Trouble Shooting for parameters that do not seem to work…

Understanding WorkItem/Process/Context  Field parameters

Process field parameters (system values)

  • In Data Selection section: If you select the Process Table then the process fields will be available to set up a process parameter (Name):
    • Process ID
    • Process Def ID
    • Process Def Main ID
    • Process Name
    • Key Field Name
    • Key Value
    • Country
    • Created By
    • Created Date
    • Owned By
    • Requested By
    • Process Start Date
    • Process End Date
    • Deadline Date
    • Department Name
    • Process Status
    • Parent Process ID

WorkItem field parameters (system values)

  • In Data Selection section: If you select the WorkItem Table then the process fields will be available to set up a process parameter (Name):
    • Process ID
    • WorkItem ID
    • WorkItem Def ID
    • Name
    • Description
    • WorkItem Type
    • Estimated Effort
    • Estimated Duration
    • WorkItem Status
    • Allocated User
    • Requested By
    • Scheduled Date
    • Scheduled Due Date
    • Actual Start Date
    • Actual Completed Date
    • Completed By

Context field parameters

help_outline
close