menu

WebPlatform Documentation

Dashboards

Why do we create dashboards for Digital Campaigns?

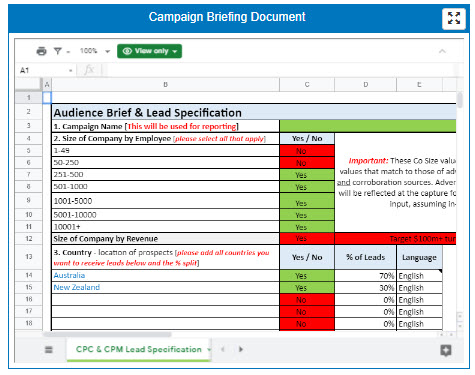
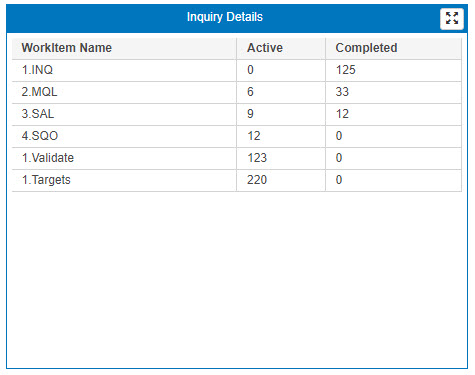
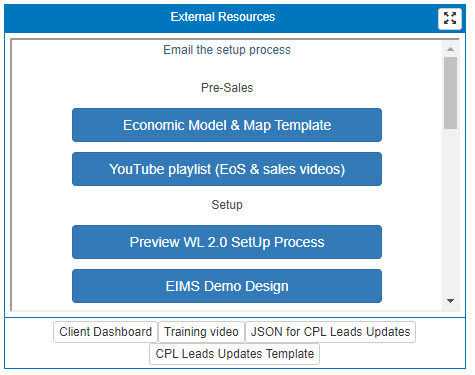
The purpose of a dashboard for digital campaigns is that it helps users who are involved in the campaign access all information such as the CBD, Inquiry Details, Live Reports and External Resources associated with the campaign from a centralised location. It also allows new users coming into the campaign to quickly and easily access content for the campaign.

Summary

The first page you will see when clicking into the Digital Dashboards module is the Client Dashboards page. Here you will be able to navigate to dashboards for a specific client

For admin users, you will also be able to access the tools associated with the campaign such as the funnel, reporting, and dashboard setup.


View Dashboard Page

When clicking on a Client and viewing a dashboard, you will find that the dashboard is a centralised location for all the resources in a given campaign. The dashboard is split into 8 tiles:

  • Campaign Setup Process
  • Campaign Briefing Document
  • Sample Advert
  • Sample Landing Pages
  • Live Inquiries
  • Inquiry Details
  • Live Report
  • External Resources

Using the dashboard

Tiles Explained

Campaign Setup Process

The Campaign Setup Process displays the WL 2.0 Process for the campaign in the tile

There are also additional buttons in the tile which link to the Preview and Overview of the WL 2.0 Process

Campaign Briefing Document

The Campaign Briefing Document (CBD) tile displays the CBD for the campaign. 

Sample Advert

The Sample Advert tile displays the an advert which is used for the Campaign.

Each campaign has Ad's which are specific to the campaign and these Ad's can be on Facebook, LinkedIn, Google etc.

Sample Landing Pages

The Sample Landing Page tile displays the an example landing page which is used for the Campaign. This landing page captures user information to create a lead.

Live Inquiries

The Live Inquiries tile displays the Process Overview for the Inquiry Process which is linked to the campaign.

When Processes get created or WorkItems are completed in the Inquiry Process, the Process in the tile animates to show the progress in the Process.

There are also additional buttons in the tile which link to the Preview and Overview of the Inquiry Process

Inquiry Details

The Inquiry Details tile displays the information for all Inquiries in the campaign. This includes the status of WorkItems in the Process.

On the dashboard when the cell in minimised, the tile displays a breakdown of how many Inquiries are currently Active or Completed and which stage in the funnel they are currently at

When the cell is maximised, a user is able to view:

  • Information for the Inquiry - this includes the Process ID, WorkItem ID, the fields in the Process for the Inquiry (e.g. Company Size, First Name, Last Name), when the process was last updated.
  • Navigate to the WorkItem for the Process by clicking on the edit icon in the Actions column for the Process
  • Filter, Sort and Search the information in the grid 

Live Reports

The Live Reports tile displays the Digital Funnel Report setup for the Campaign. Click here for more information on what the Digital Funnel Report includes

Also in this tile there are buttons which link to other reports for Digital Campaigns such as the Agent Activity Report, Activity Audit Report and also the Publisher Report

External Resources

The external resources tile displays any extra information or documentation which is used for the campaign e.g. training documentation. The tile also displays when the reports will be synced on a daily basis and also the report repository for Bulk Updates in the campaign

Other types of dashboards and how to set these up

For more information on EIMS Non-Digital Campaign Dashboards and also how to create Dashboards, please see the links below.

help_outline
close