menu

WebPlatform Documentation

Content Syndicaton (CPL) Statistics Report

Summary

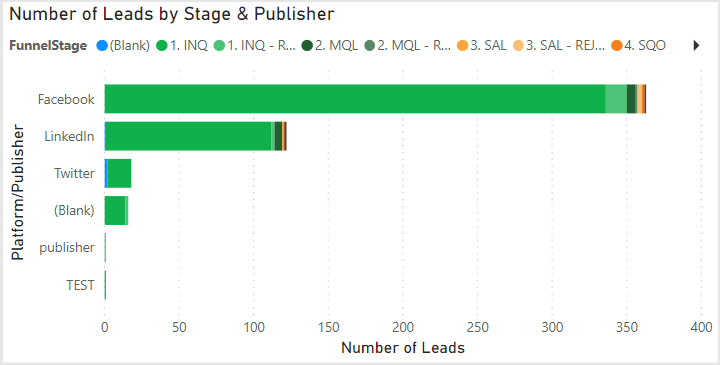
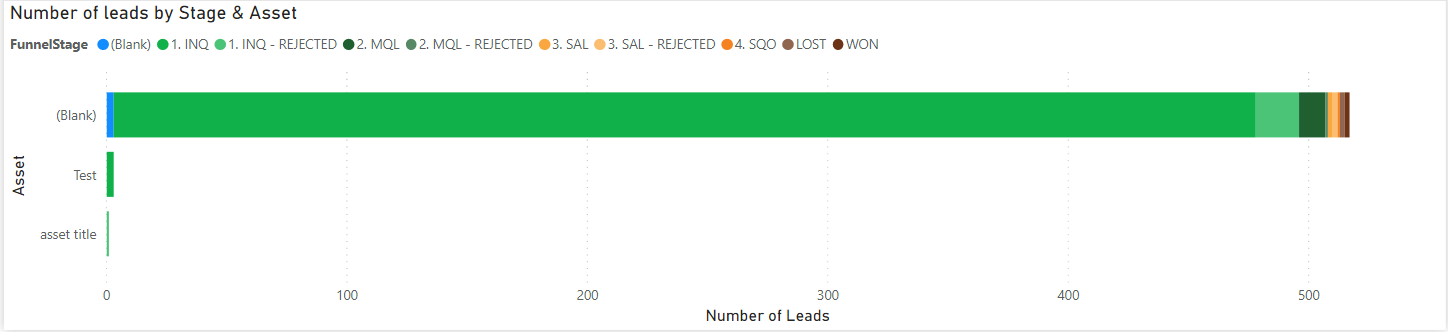
Content Syndication leads are generated from different Assets, Publishers and Advertisers for campaigns. This dashboard displays the leads generated by Assets, Publishers and Advertisers and the Funnel Stages for these leads. This allows Campaign Managers to understand which Assets, Publishers and Advertisers have been the most effective in a campaign.

Bar Chart: Number of Leads by Stage & Advertiser

This bar chart displays the Advertisers used for the campaign and the Funnel stages for the leads linked to these Advertisers

Bar Chart: Number of leads by Stage & Publisher

This bar chart displays the Publishers used for the campaign and the Funnel stages for the leads linked to these Publishers

Bar Chart: Number of leads by Stage & Asset

This bar chart displays the Assets used for the campaign and the Funnel stages for these leads by Asset

Drill through into Lead Details

You can drill through to the specific lead details by right clicking on a portion of the bar and selecting the drill through option. Click 'LeadDetails' to view this information for the Funnel Stage selected.

Watch the GIF below to see how easily this is done

To return to the dashboard click the 'Go Back' button in the top left corner of the report

help_outline
close