This Documentation explains each tab in the Content Syndication Digital Standard Funnel Report. The aim is to support AMs and BUDs with the weekly reporting of Content Syndication / PMP programs and should be utilized to manage Content Syndication programs successfully.
What to know before using the funnel report
The funnel report is set-up during the CSU and/or CSY Order Process, depending on whether the set-up is a new logo, new FOP or continuation of existing funnel. In most cases, you will only have one funnel per client – IF the currency shown in the funnel is the same. i.e. 1 funnel for USD programs, and a separate funnel for EUR programs.
For each separate program / SOW a new dashboard will be created but will link to an existing funnel when you select New FOP or Continuation in the set-up process.
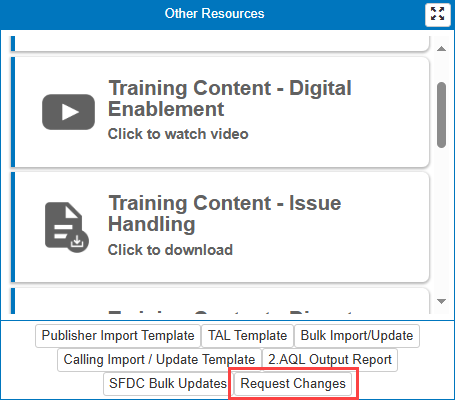
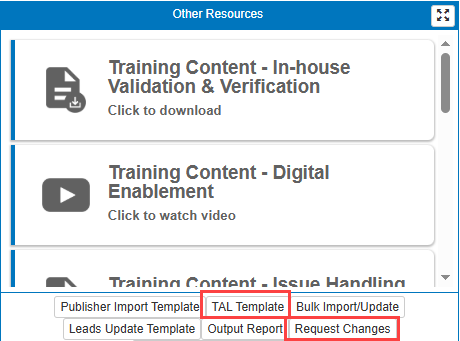
Any changes required to the funnel, should be managed through the ‘Other Resources’ tile on the campaign specific dashboard using ‘Request Changes’:
Click the Request Changes button at the bottom of the tile and follow the WMS process. Changes that can be requested, but not limited to are:
Change of assets – please fill in the AssetMapping tab in the Output template to add new assets to the program in the same format as per the original / first campaign set up (the asset names will need to be programmed into the funnel to ensure validation of INQs is accurate)
Update B.C.R (Benchmark Conversion Rates)
Total budget
Changes in lead scoring metrics
Updates to LOV in fields and/or Publisher template updates
Addition of new TALs to track performance in the ABM Metrics tab and Profiling Analysis tab (new accounts must be submitted in the format of the downloadable ‘TAL Template’)
Updates to profiling questions and or answers
Changes to existing API e.g. new fields or set up of API instead of a SQL2XLSX Output Report
Changes to Output Reports
Addition of channels in the Performance Metric tabs
Etc.
All requests must be clearly written in SPIN format (please remember, a short and concise description is more valuable than lengthy convoluted explanations).
Digital Funnel
The funnel report can be accessed from the live reports tile on each campaign dashboard. The Digital funnel tab contains the full end to end sales funnel and displays the total leads, active and rejected for each sales stage. The funnel also shows the cost per lead and the value for each stage.
Adjustable Funnel Stages & Regional Filter
The original funnel report had a static number of sales stages on the funnel however, the most up to date funnel reports will adjust according to the sales stages configured within the funnel configuration tool in the campaign dashboards module.
Region filters are also available on the most up to date funnels.
Source Type Filtering on the Funnel
You can add an additional layer of Filtering to the Funnel which is by Source Type.
This allows you to see the statistics for the campaign by a specific Source Type e.g. PaidMedia, ContentSyndication, Calling or DEaaS
Filtering by SourceType is available on the most up to date funnels.
Full list of filters in the Funnel Report
Region
SourceType
Campaign
Channel
Creative
Lead Source
Agency Placement Name
Publisher
Country
Asset 1
Asset 2
Industry
Job Function
More filters can be added upon request, and on the proviso that the data submitted to the WMS process contains meaningful values ie. Requesting a filter for a field of type free text is of no value.
What you need to know for 'Publisher' filter
The funnel report covers multiple sources : Paid Media, Content Syndication & Calling. Publisher data will be available for both Paid Media & Content Syndication, so you will be able to select any Publisher used for a client in this filter.
General details regarding Sync
Why does this report need syncing?
To generate the report, we get the data from different sources (Digital & WMS) and bring it together within a Data Warehouse. So, to ensure this data marries up correctly, we need to synchronise the data at a set time. This ensures that the calculations in the report are accurate. The report is synced daily.
Last Sync Date Time - Displays the last date & time the data was synchronised in the Data Warehouse.
Next Sync Date Time - Displays the next date & time the data will be synchronised in the Data Warehouse.
Funnel Metrics
Purpose
To allow funnel analysis by campaign (of all results aggregated together), so we can compare effectiveness of campaign tactics. This report is intended more for Content Syndication than Paid Media, because it does not contain “above funnel” data such as impressions and clicks (which content syndication publishers will generally not give us access to).
Built because the “TOFU”, “BOFU” and “Platform metrics” tabs assumed only one campaign tactic per campaign, and so this tab supersedes those 3 [older] tabs. In Louis’ opinion, these tabs are redundant. However, this tab does not allow filtering by date range, so for the time being we’ll keep the older tabs (just in case).
How to use / Interpret
The funnel tab allows you to easily compare different digital inputs. This table is designed to easily compare, by input, the performance from top of the funnel all the way down to bottom of the funnel. Note: this is only possible if this data is captured and updated via the Bulk Import/Update process, meaning if the data does not exist the expected return is blank.
By default you can filter by the following:
Campaign – these are the individual campaign name line-items within a Content Syndication program, i.e. Asset1PublisherACountryY, Asset1PublisherBCountryY
Channel – this can include DAAS, Content Syndication, Calling, Paid Media (LinkedIn, Facebook, Instagram, Google Search, Display, Native)
Country – a list of all countries supplied to LMS in the output template
Tip: only supply countries that are actively targeted, as otherwise the dropdown list will show all countries and no values against all unused ones.
Creative [Asset] Name (Asset Name 1) – list of first asset downloads (if this is being captured in the program)
Creative [Asset] Name (Asset Name 2) – list of second asset downloads (if this is being captured in the program)
Industry – a list of industries supplied to LMS in the output template
Job Function – a list of job functions supplied to LMS in the output template
Publisher – the publisher selected for a program
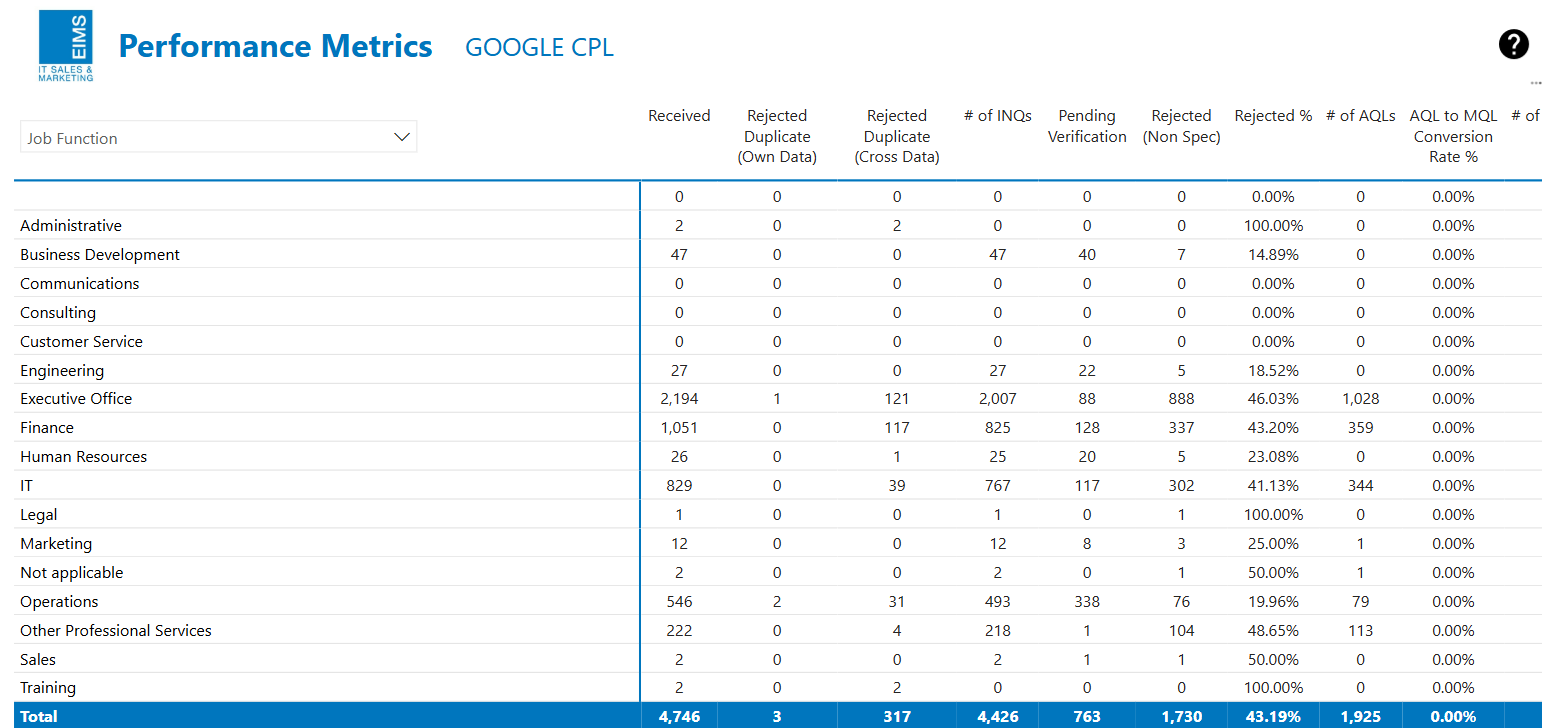
The table displays several metrics to help provide insights into the program performance. The first section of the table shows information regarding INQ delivery and quality (i.e. rejection, acceptance).
Below is an example of the vertical tabs showing additional insights for inquiries provided and their progress down the sales cycle. The vertical tabs will remain the same, irrespective of the filter selected.
Please note: a discrepancy can exist between total number received from publishers vs. # of INQs. This is due to the fact the total number received from publishers is only showing content syndication leads. If you have additional sources feeding the funnel, this will not be captured in the first 3 columns but will show up from # of INQs onwards.
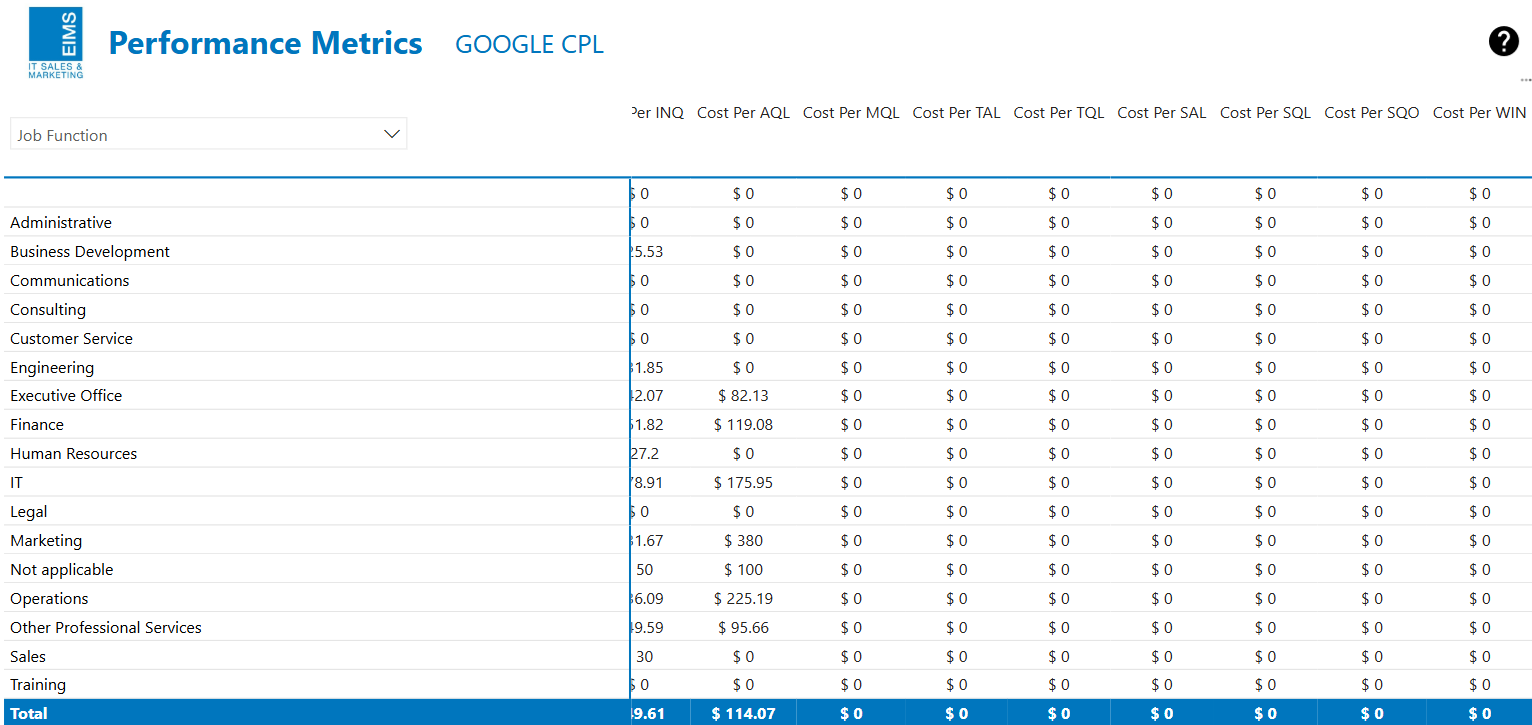
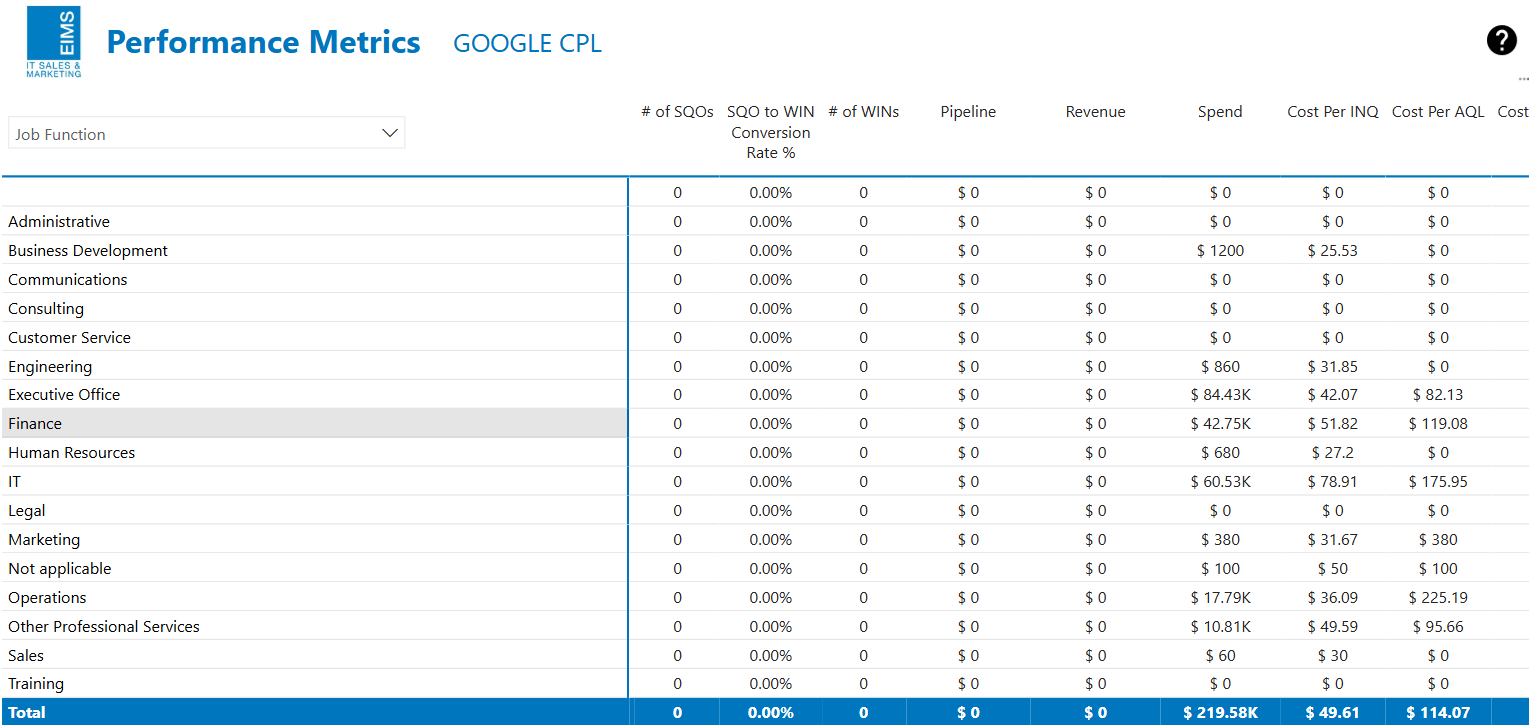
Scrolling right in the table, several performance metrics are displayed related to conversion rate, cost per lead and ROI. This table is also filterable by the inputs as described above.
Note:
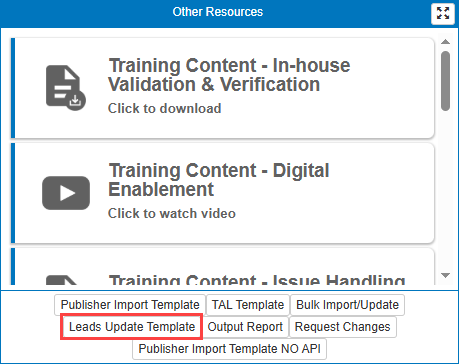
The quality of data in this view is dependent on data inputs received from the publishers or form fill (where source type is PaidMedia). The first 8 columns will be populated with data supplied by publishers and the data validation team (up to # of AQLs). The remaining data points will only be visible if down-funnel updates are received and processed regularly (weekly is best practice), by using the Leads Update Template. Template can be found on the dashboard, under the 'Other Resources' section as shown below.
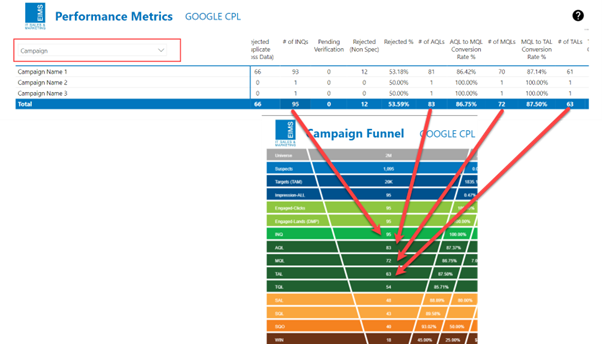
Data visible in the Performance Metrics tab will relate to the same lead stages which can be found in the Campaign Funnel tab as shown below.
Weekly Scorecard - TOFU Metrics
Purpose
This tab is more relevant for Paid Media [Search, Display, Social] campaigns [and less for Content Syndication], because it shows events and activity that take place before we get INQuiries, and then uses AI to connect them to INQuiries further down the funnel [to measure ROI of Paid Media], which the “Performance Metrics” [tab] does not. For example: it containsadditional “before Inquiry” data not contained in the “Performance Metrics” tab, such as impressions and clicks. In addition, this report shows Paid Media budget / spend, which is not on the “Performance Metrics” tab.
How to use / interpret
The TOFU Metrics tab is a weekly scorecard for Top of Funnel (TOFU) data such as spend, impressions, and clicks.
This tab is more relevant for Paid Media [Search, Display, Social] campaigns [and less for Content Syndication], because it shows events and activity that take place before we get INQuiries, and then uses AI to connect them to INQuiries further down the funnel [to measure ROI of Paid Media], which the 'Performance Metrics' [tab] does not. For example: it contains additional 'before Inquiry' data not contained in the “Performance Metrics” tab, such as impressions and clicks. In addition, this report shows Paid Media budget / spend, which is not on the 'Performance Metrics' tab.
Week Definition
This tab displays data on a week by week basis. A week is defined as:
Starting on the Monday and ending on the Sunday.
Week 1 relates to the week that starts 1st January. Example: 2021 - Week 1 date range: Friday 1st January 2021 - Sunday 3rd January 2021
Week 2 relates to the following full week starting Monday, Example: 2021 - Week 2 date range: Monday 4th January 2021 - Sunday 10th January 2021
TOFU Metric Table - Metric Definitions
The table shows 9 Top of Funnel performance metrics:
Column Name
Definition
Spend
Total amount spent on the campaign for the period.
Cost Per
The Cost Per INQ for the period.
INQs
The total number of form fills for the period.
CVR
The conversion rate from a click to a INQ for the period.
CPC
Cost Per Click for the period.
CTR
Click Through Rate (CTR) of an impression to a click for the period.
Lands
The number of people who have clicked an advert and viewed the landing page within the period.
Clicks
The number of people who have clicked an advert but may not have necessarily viewed the landing page within the period.
Imps.
Impressions. The number of people who have viewed an advert within the period.
TOFU Metric Table - Period Definitions
The metric table shows totals for each metric (column) against 3 different periods; Current Period, Previous Period, and Previous 4 Periods.
Period Type
Definition
Current Period
The full week selected in the "Select the week to compare" dropdown. If a value has not been selected in the dropdown then the week you are in whilst viewing the report will be used.
Example: 2021 Week 36 selected in the dropdown. Columns will be calculated for week 36 (between 30th August 2021 - 5th September 2021).
Previous Period
The full week prior to the Current Period.
Example: 2021 Week 36 selected in the dropdown. Columns will be calculated for week 35 (between 23rd August 2021 - 29th August 2021).
Previous 4 Periods
4 week aggregate including the Current Period.
Example: 2021 Week 36 selected in the dropdown. Columns will be calculated for the weeks 33 - 36 (between 9th August 2021 - 5th September 2021).
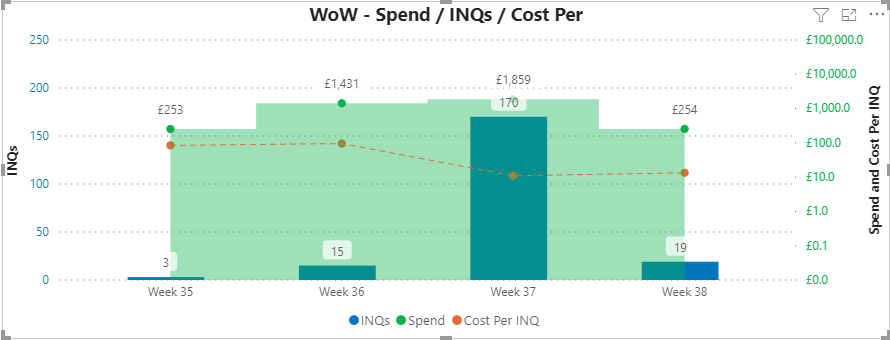
TOFU Week on Week (WoW) - Spend / INQs / Cost Per
The TOFU WoW graph is a week on week breakdown of the Previous 4 Periods.
The blue bars display the number of INQs generated for each week (Left sided Y-axis)
The green area shows the amount spent across the 4 weeks (Right sided Y-axis)
The orange dotted line is the Cost Per INQ for each week (Right sided Y-axis)
The left sided Y-axis follows a linear scale whereas the right sided Y-axis follows a Logarithmic scale
TOFU All Time Marketing channel Funnel, Pipeline, and Revenue
The right hand side of the TOFU Tab displays metrics across the entirety of the campaigns duration.
All Time Marketing Channel Funnel
The marketing channel funnel is a mini funnel showing the total number and Cost Per for each Marketing & Sales stage of the funnel.
Budget Optimised (CPL)
The total cost of Inquiries that have been disqualified / rejected where Source Type = ContentSyndication. This is not charged to the client and represents how much the client has saved.
All Time Pipeline Value & Revenue
The all time pipeline value represents the total value of SQOs across the campaign's duration.
The all time revenue value represents the total value of SQOs that were generated and converted to a won deal across the campaign duration.
Weekly Scorecard - BOFU Metrics
Purpose
In Louis’ opinion, this tab is redundant, if the “Performance Metrics” [tab] can be filtered by “Platform” (aka “Channel” in the filters).
How to use / interpret
The BOFU Metrics tab is a weekly scorecard for Bottom of Funnel (BOFU) data such as total number of INQs and the total that have progressed down the sales funnel, the pipeline value, and the amount of revenue generated.
Week Definition
This tab displays data on a week by week basis. A week is defined as:
Starting on the Monday and ending on the Sunday.
Week 1 relates to the week that starts 1st January. Example: 2021 - Week 1 date range: Friday 1st January 2021 - Sunday 3rd January 2021
Week 2 relates to the following full week starting Monday, Example: 2021 - Week 2 date range: Monday 4th January 2021 - Sunday 10th January 2021
BOFU Metric Table - Metric Definitions
The table shows 10 Bottom of Funnel performance metrics:
Column Name
Definition
INQs
The total number of form fills for the period.
CVR
The conversion rate of INQs to MQLs for the period.
MQLs
The total number of INQs that were generated and progressed to a Marketing Qualified Lead (MQL) within the period.
CVR
The conversion rate of MQLs to SALs for the period.
SALs
The total number of INQs that were generated and progressed to a Sales Accepted Lead (SAL) within the period.
CVR
The conversion rate of SALs to SQOs for the period.
SQOs
The total number of INQs that were generated and progressed to a Sales Qualified Lead (SQO) within the period.
Pipeline
The total value of INQs that were generated within the period.
WINs
The total number of INQs that were generated and converted to a won deal within the period.
Revenue
The total value of the WINs for the period.
BOFU Metric Table - Period Definitions
The metric table shows totals for each metric (column) against 3 different periods; Current Period, Previous Period, and Previous 4 Periods.
Period Type
Definition
Current Period
The full week selected in the "Select the week to compare" dropdown. If a value has not been selected in the dropdown then the week you are in whilst viewing the report will be used.
Example: 2021 Week 36 selected in the dropdown. Columns will be calculated for week 36 (between 30th August 2021 - 5th September 2021).
Previous Period
The full week prior to the Current Period.
Example: 2021 Week 36 selected in the dropdown. Columns will be calculated for week 35 (between 23rd August 2021 - 29th August 2021).
Previous 4 Periods
4 week aggregate including the Current Period.
Example: 2021 Week 36 selected in the dropdown. Columns will be calculated for the weeks 33 - 36 (between 9th August 2021 - 5th September 2021).
BOFU Week on Week (WoW) - Count by Lead Stage
The BOFU WoW graph is a week on week breakdown of the Previous 4 Periods.
The orange bars display the total number of active MQLs for each week (Left sided Y-axis)
The grey bars display the total number of active SALs for each week (Left sided Y-axis)
The yellow bars display the total number of active SQOs for each week (Left sided Y-axis)
The light blue bars display the total number of WINs for each week (Left sided Y-axis)
The blue area shows the number of INQs generated for each week (Right sided Y-axis)
BOFU All Time Marketing channel Funnel, Pipeline, and Revenue
The right hand side of the BOFU Tab displays metrics across the entirety of the campaigns duration.
All Time Marketing Channel Funnel
The marketing channel funnel is a mini funnel showing the total number and Cost Per for each Marketing & Sales stage of the funnel.
Budget Optimised (CPL)
The total cost of Inquiries that have been disqualified / rejected. This is not charged to the client and represents how much the client has saved.
All Time Pipeline Value & Revenue
The all time pipeline value represents the total value of SQOs across the campaign's duration.
The all time revenue value represents the total value of SQOs that were generated and converted to a won deal across the campaign duration.
Weekly Scorecard - Platform Metrics
Purpose
This allows the user to compare effectiveness of Platforms [Google 360, Search, Facebook, etc.] regardless of which campaign tactics have been run in those platforms. This information is used to move budgets between Platforms as part of optimisation.
In Louis’ opinion, this tab is redundant, if the “Performance Metrics” [tab] can be filtered by “Platform” (aka “Channel” in the filters).
How to use / interpret
The Platform Metrics tab is a breakdown of the TOFU Metrics for each platform used with Paid Media. TOFU metrics are displayed for the following platforms:
Google
Bing
LinkedIn
Facebook/Instagram
DV360
Twitter
Quora
The platform buttons along the top of the tab will display/hide the relevant platform metrics. The metrics are visible when the background colour is solid blue and hidden when the background colour is transparent.
Weekly Scorecard - Custom Date Range
Purpose
Reporting on date ranges is problematic, because what gets included in a date range can be very contentious or confusing. This report:
defines what gets included (to reduce confusion) and
defines meaning (to reduce contention).
The report selects INQuiries that were made during the selected date range. It then seeks to find out what happened to those inquiries, and show their current status (even if the status change was outside the selected date range). This means wins inside the date range that arose from inquiries outside the date range won’t show. This allows you to relate ROI directly to spend. This is particularly important for products with longer sales cycles, when the revenue might come in long after the digital campaign has been “optimised” or even closed down.
How to use / interpret
The custom date range tab allows you to select 2 date ranges and compares the TOFU and BOFU metrics. There are 2 sections to the tab; results based on the INQ created date and results based on all activity.
Results based on INQ creation date
The TOFU and BOFU metrics are calculated where the original INQ created date falls within the 2 date ranges selected.
Example 1:An INQ is created within the selected date range, and within that range it also moves from INQ to MQL, but then moves to SALoutsidethe bounds of the selected date ranges. The metric tables would show the INQ count and MQL count, but not the SAL count (as the SAL did not occur within the selected date range).
Example 2:An INQ is createdoutsidethe selected date ranges, but becomes an MQLwithinthe selected date ranges. The metric tables would not showthe MQL count, as the original INQ was not created within the selected date range.
Results based on all activity
The TOFU and BOFU metrics are calculated where any activity has occured within the 2 date ranges selected.
Example 1:An INQ is created within the selected date range, and within that range it also moves from INQ to MQL, but then moves to SALoutsidethe bounds of the selected date range. The metric tables would show the INQ count and MQL count, but not the SAL count (as the SAL did not occur within the selected date range). This example stays the same, as the SAL activity occurs outside of the selected date range.
Example 2:An INQ is createdoutsidethe selected date range, but becomes an MQLwithinthe selected date range. The TOFU and BOFU metricswill showthe MQL but not the INQ, as the INQ was created outside of the selected date range but became an MQL within the selected date range. This example changes, and we would now see the MQL count reflect activity where the original INQ was not created within the selected time period.
ABM Metrics
Purpose
To identify those Accounts (companies) who are most interested (engaged). Essentially the more interested the account, the more processes there will be for that account.
How to use / interpret
The ABM Metrics tab shows engagement metrics per account. Accounts are supplied via the TAL Template. Utilize this tab to prioritize data for your sales team to follow up on. The tab will display accounts with engagement levels based on number of unique engagements (from calling, content syndication, DEAAS or Paid Media) and per type (single-touch, multi-touch, profiling questions, BANT).
When changing / adding to the TAL, please make sure to start the 'Request Changes' process and provide LMS with the accounts that must be added. Any accounts that have been removed from the TAL will still appear in the account list as historical data can still be tracked. Make sure to download the ‘TAL Template’ to ensure you request uploading accounts in the correct format, also accessible in the ‘Other Resources’ section. If TAL is supplied in any other format, your request be rejected.
Definition for top headers:
Total Accounts – distinct count of accounts from the TAL (Target Account List) – This means unique number of accounts in the TAL list. This number will go up when more accounts are provided.
Accounts Engaged - Count of processes by distinct company name. This means we have inquiries for these accounts. This is the total number of INQs passed over by publishers, prior to being validated by the validation/verification team.
Accounts Engaged Passed - Count of distinct company names which have been passed over to the client as an AQL (after validation & verification)
Total engagements (Passed) - Count of AQLs that have been passed to client after being accepted by the validation & verification team.
Avg engagement (Passed) - Total engagements (passed) / Accounts engaged. This means average number of AQLs per account passed to client.
Avg engagements by type - Total engagements (passed) / Distinct count of program types. This means average number of AQLs (inquiries) per program type. Program types are divided by: Profiling Questions, Multi-Touch, Single Touch/Asset, BANT). As an example, if 5 AQLs have been sent to the client these could have been generated from a multi-touch content syndication program, followed up by a BDR and BANT qualified
Explanation of additional fields on the ABM Metric tab:
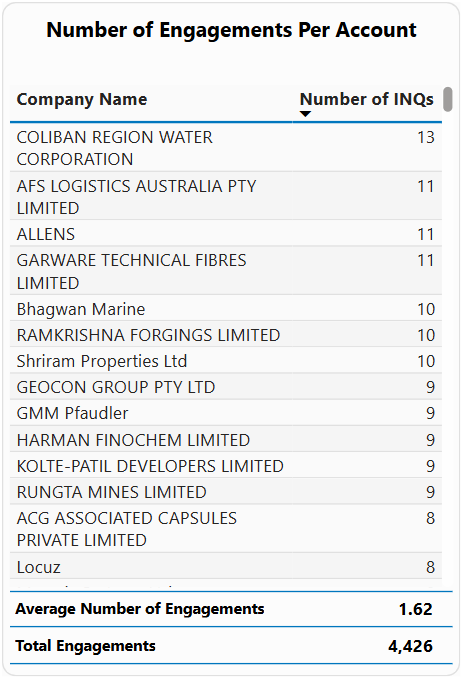
Number of Engagements Per Account
Shows total number of INQs generated per account. These are all inquiries generated per account prior to acceptance/rejection from the validation & verification team.
An engagement is defined as a form fill from any channel (content syndication, LinkedIn, etc.), or attending an event (physical | webinar)
Average Number of Engagements shows total INQs divided by total number of accounts.
NB: the field will show all accounts loaded into the funnel. Accounts can be added if required by clicking the 'Request Changes' button under the 'Other Resources' tile on the dashboard.
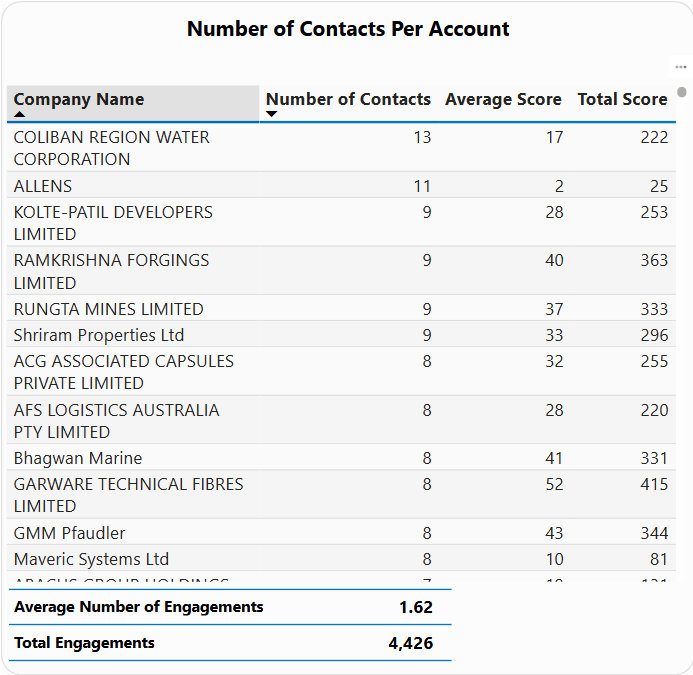
Number of Contacts Per Account
Shows the total number of unique contacts per account who have engaged via one or more engagement types/sources
Average Score shows the average score per contact per account based on the scoring metric which can be found in the Scoring Audit tab at the bottom of the funnel report.
Total Score is the total score for an account based on interactions by unique contacts as well as the lead scoring as per Scoring Audit tab.
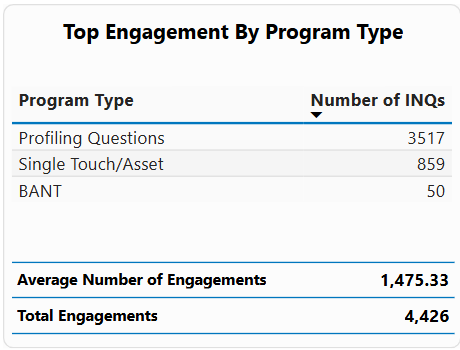
Top Engagement By Program Type
Shows the total number of INQs (prior to validation & verification approval) generated per program type. A program type is defined during the set-up of a program in the Output template.
The different program types are Profiling Questions (both content syndication as outbound calling), Multi-Touch or Single-Touch/Asset for content syndication, and BANT for calling programs.
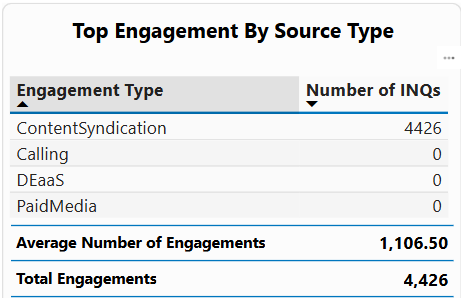
Top Engagement By Source Type
Shows the total number of INQs (prior to validation & verification approval) generated per Source Type. A source type is related to the source of the data and is defines the path data will follow in the WMS process.
The different source types are: ContentSyndication, PaidMedia, Calling & DEaaS.
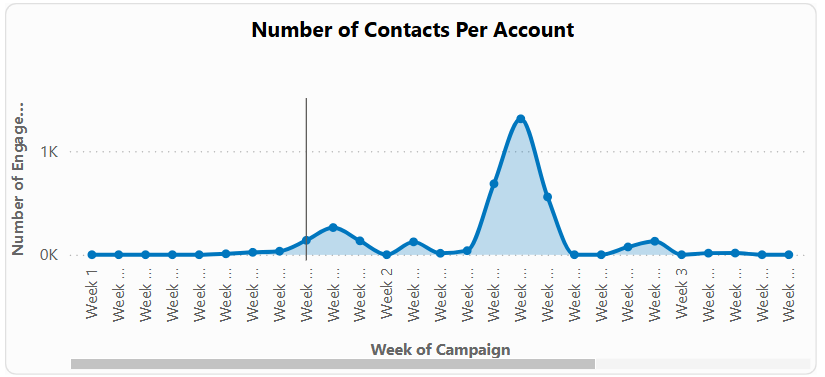
Number of Contacts Per Account
This is a week-by-week view of how many contacts have been supplied by account on average.
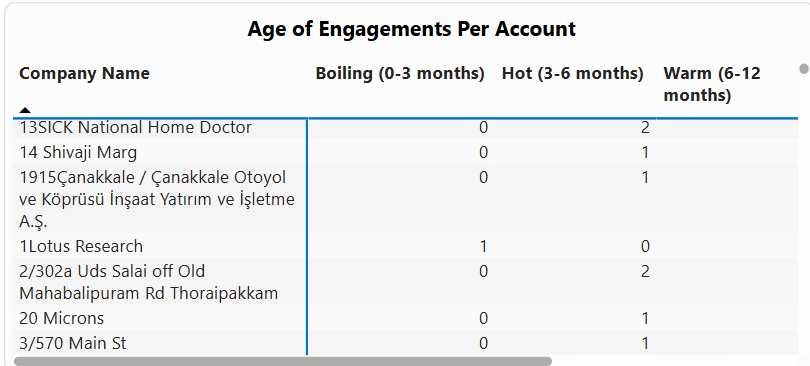
Age of Engagements Per Account
Shows the last engagement within an account within a specific timeframe. The timeframes are divided into:
Boiling (0-3 months)
Hot (3-6 months)
Warm (6-12 months)
Nurture (12+ months)
This view will allow AMs / BDR managers to prioritize account follow up
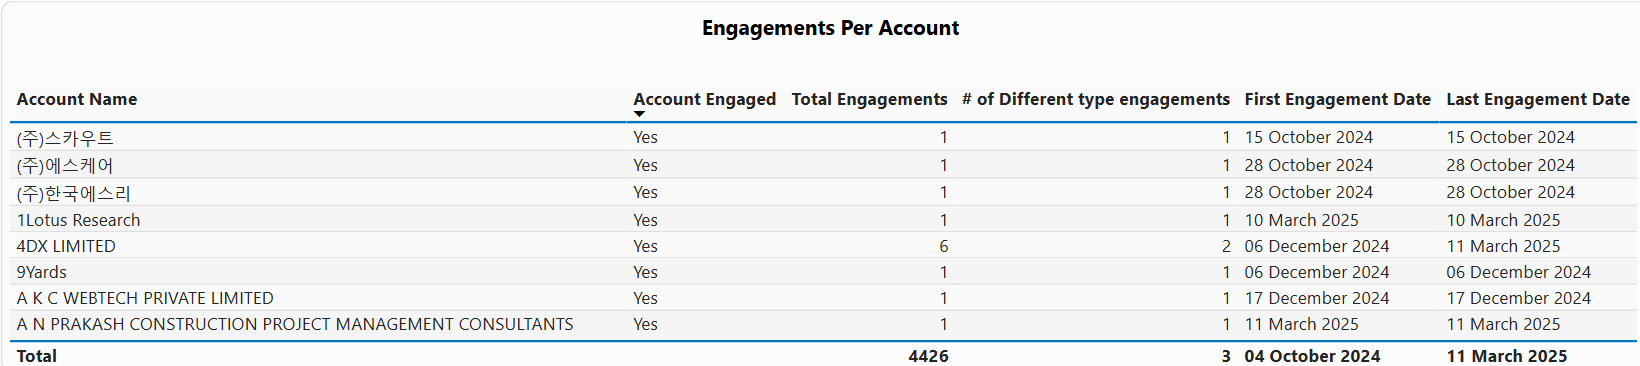
Engagements Per Account
This provides an overview on an account level and can be used to quickly identify if there is any level of engagement within a specific account (column 2), how many total engagements there are within a specific account (column 3), an overview of the different type of engagements, i.e. Paid Media, DEaaS, Calling (column 4), and an overview of when the first and last engagement in a specific account took place (column 5 and 6).
Profiling Questions
Purpose
Campaigns sometimes have ‘profiling questions’. This tab shows how often those questions were answered. A prospects answers to these questions might be used to make calls more relevant, or to put the lead into the most appropriate nurture track.
How to use / interpret
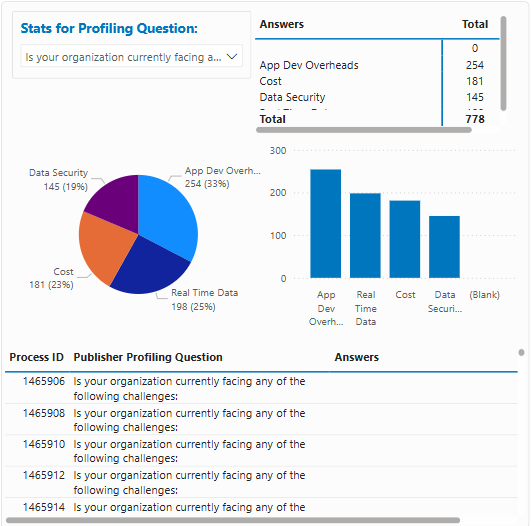
This tab will show profiling questions which are part of a specific program. It is possible to include profiling questions in content syndication programs which have profiling questions displayed on the landing pages, or if a tele-qualification activity is undertaken, the tile will show the answers to the UDQs (User Defined Questions).
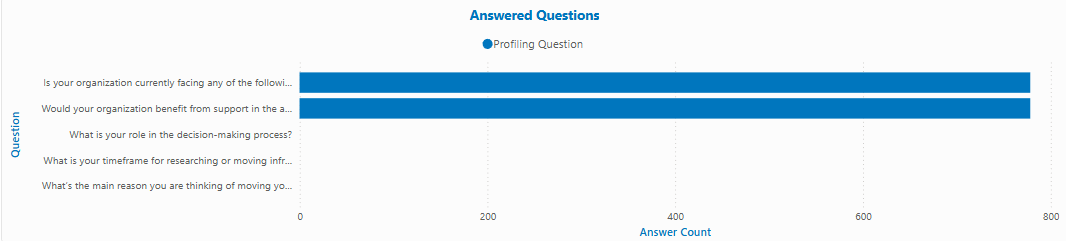
The first tile shows total number of answered question by profiling questions
The other two tiles will show insights based on specific profiling questions or tele-qualification questions. You can select a profile question to display the spread of answers per profile question.
Below each profiling question there is an option to select a specific Process ID to drill down further into the details of the lead if required.
This is both true for profiling questions and tele-qualification questions.
Scoring Distribution
Purpose
One can automatically score each lead, based on weights attached to the prospects characteristics and answers. These scores are presented on this tab to show the distribution of leads by score. This is better than traditional [Hot | Warm | Cold] style categories, because it adapts to reality, rather than aspiration, and then allows you to decide which leads to follow up based on your sales capacity to do so.
If one didn’t have this system, one might have only a few “Hot” leads being followed up, and many perfectly good leads would languish and deteriorate over time.
This system is more easily optimised: by adapting the scoring system over time, you can tweak your lead scoring in a quantitatively objective way to maximise sales.
How to use / interpret
The Scoring Distribution tab pulls its data from the Scoring Audit tab, this is where the lead scoring methodology is displayed. If your campaign does not have a lead scoring matrix to attribute scores to answers or populated fields, no stats will show.
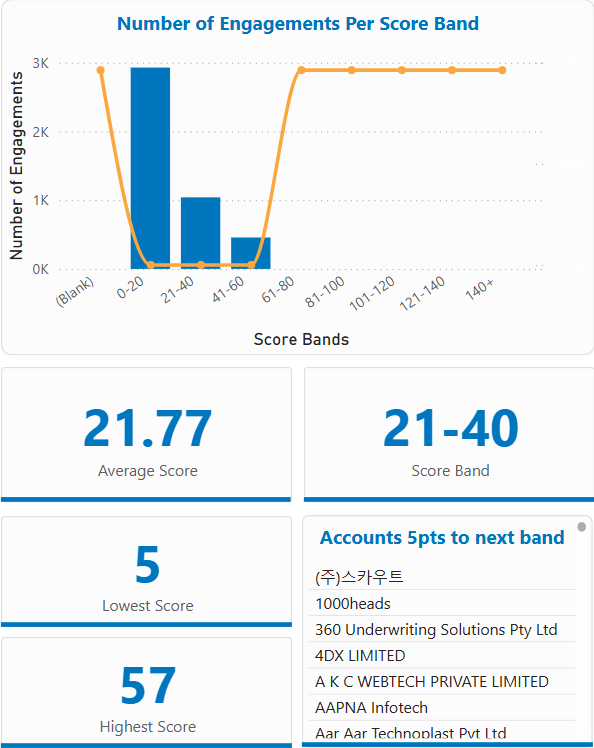
The lead scoring has been grouped into ‘bands’. Each band is made up of 20 points, based on the lead scoring.
By clicking on a band (click on a bar in the chart) the page will display the average score of that band, the lowest score and the highest score in that band. In addition, there is box displaying all accounts that only need 5 more points (25% of that bands scoring) to jump to the next band. This is useful to direct the SDR team where to focus their time, and for marketing to drive additional activities into these accounts to move them quickly along to the next band.
The Profiling Analysis tab also includes detailed information on each inquiry, including ProcessID, demographic and firmographic information, Lead Scoring, Cost per lead, and if uploaded, sales comments, stages, opportunity values, inquiry status and potential reasons for disqualification.
Scoring Audit
Purpose
This tab shows the scoring model used for this process (in the pie chart). It also shows each process that has achieved a score, together with each field that contributed to that score (in the table below). To fully investigate and validate a score in order to establish veracity, one can ‘drill-down’ into each individual lead (process). Used together, these tools allow one to see how well the scoring model is working, and gain insight on how it might be improved.
How to use / interpret
The Scoring Audit tab gives an overview of the lead scoring used for a program. To update or alter the lead scoring, follow the same process as with all other change requests; simply click on the 'Request Changes' tab on the dashboard under the 'Other Resources' tile and supply your new lead scoring matrix. Note: Changes might only apply to new instances of the WMS process i.e. new inquiries.
Field Values & Scores gives you an overview of all the lead scoring values available as well as the distribution of these scores across the generated inquiries.
All tables / graphs are responsive to any selection made in 'Field in Scoring Settings' or 'Process ID'. To return to general settings, just click on 'Clear Selections'.
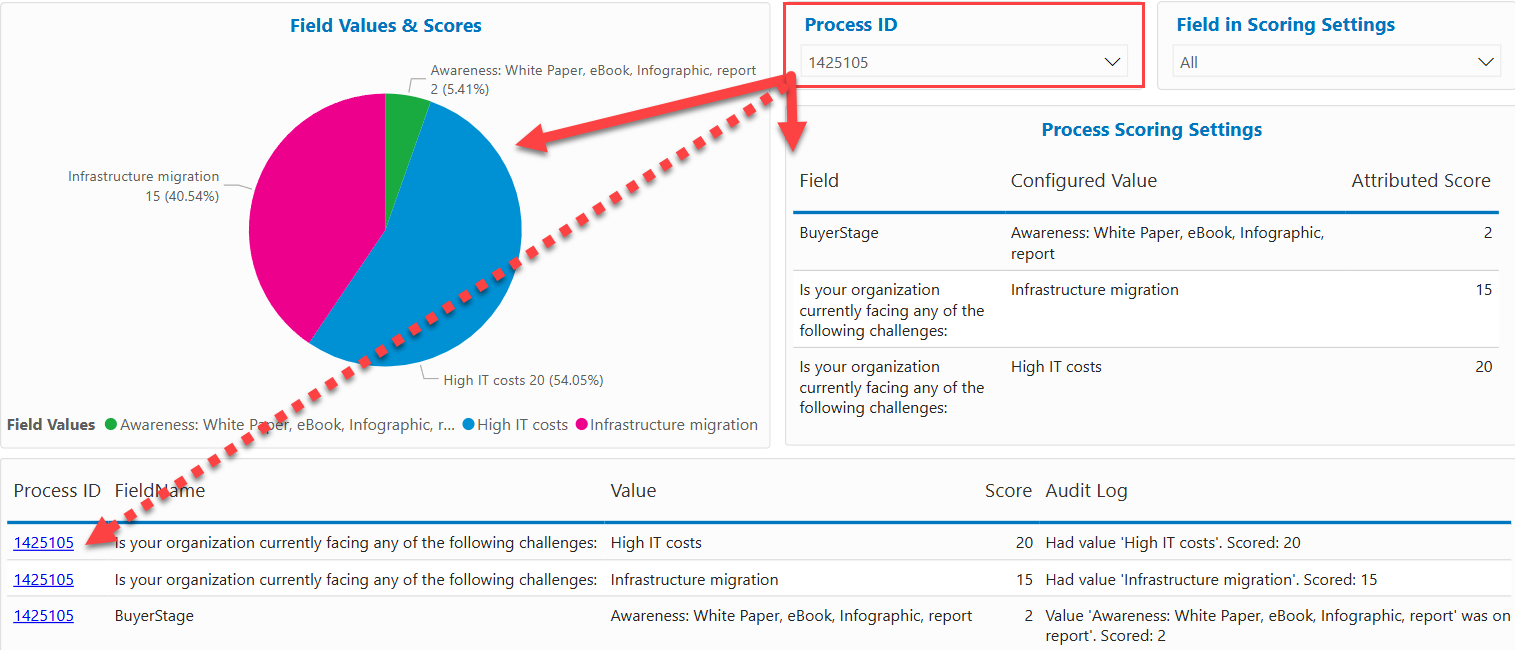
Process ID allows you to search by ID to show all relevant lead scoring metrics for a specific inquiry.
Field in Scoring Settings allows you to select a specific scoring metric, i.e. Buyer Stage, Demographic, Intent Timing, or the answers to profiling questions.
See below an example, where a ProcessID is selected – i.e. a specific INQ, so all stats relate to this inquiry only.
Another example. In the image below 'Demographic' is selected, so all stats relate to this field only.
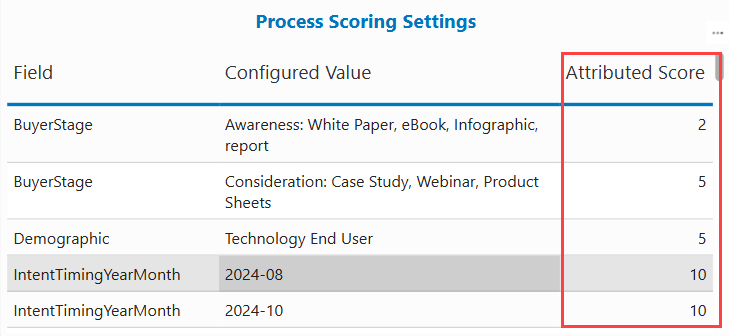
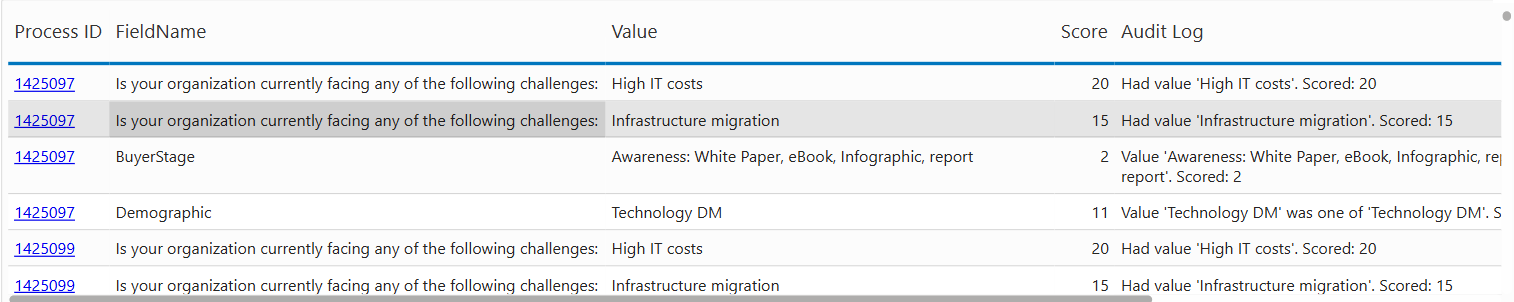
Process Scoring Settings shows the lead scoring metrics used for a program. These are split out by: Buyer Stage, Demographic, Intent Timing (shown by Year and Month), Publisher Profiling Question & Answer, and Tele UDQ Answers.
Each section is subdivided by the configured values and the attributed scoring:
The last table on the Scoring Audit tab provides more detail by Process ID and demonstrates which specific trigger resulted in the attributed scores and provides an audit log (proof points). Scroll right to read full line of text where necessary.
Any update to a specific tab, i.e. lead scoring, profiling questions, or additional accounts to be measured, must be requested via the dashboard button 'Request Changes'.
To start populating the funnel properly, data from the client is required. The correctness of the data in the funnel is solely dependent on the quality of data uploaded into the funnel (inquiries emailed to the WMS process). To update the funnel with the latest information (BOFU - progress of inquiries in the client system), go to the dashboard, find the 'Other Resources' tile and click on Bulk Import/Update.
You must normalize the (BOFU) data you receive from the client to ensure all fields match /align with the field names in the funnel – the data team can support if required. Use the 'Leads Update Template' to normalize the data and for bulk import/update. This template can be found in the same location as the Bulk Import/Update; under 'Other Resources' tile.
Enablement Training Video
Glossary
Purpose
Contains a list of terms used in the report with accompanying definitions.
How to use / interpret
The Glossary tab provides definitions for the sales stages/terms used for the EIMS funnel configuration.
MAP
Purpose
Section where EIMS sales stages used in the funnel configuration can be mapped to other industry standards or the sales stages used by a client.
How to use / interpret
This tab shows how the standard Sirius sales stages pair between both the EIMS sales stages and the clients sales stages.
Target Segments
Purpose
Target segments are specific, defined groups within a larger market that share similar characteristics and are chosen for focused marketing efforts. These segments are identified by analysing customer data and grouping individuals based on demographics, behaviours, needs, or other relevant factors. By understanding these segments, businesses can tailor their marketing strategies, product development, and overall messaging to resonate more effectively with each group.
How to use / interpret
This tab breaks down the approached targets for the campaign into the relevant segment, channel and source and details the number of duplicates that were included within the campaign.
Benchmarks
Purpose
A standard or point of reference against which things can be compared.
Benchmarking is defined as the process of measuring products, services, and processes against those of organisations known to be leaders in one or more aspects of their operations.
How to use / interpret
The benchmarks tab provides a breakdown of the projections that have been agreed and forecasted at the start of the campaign, this includes: conversion rates, cost of follow ups and volumes based on the campaign budget.
Budget performance
Details regarding Budget Performance
The funnel report displays the budget performance for the campaign so the Account Manager (AM) can see how fast the budget is being spent and report this back to the client. This gives visibility to both the AM and the client on how the campaign is performing from a budget perspective and outlines what the projected campaign end date is based on budget that is spent.
The budget performance displays five pieces of information:
Start Date - this is the start date of the campaign
End Date - this is the projected end date for the campaign
Projected Daily Budget Spend - this is calculated on the total budget for the campaign divided by the number of days between the start date and end date. This calculation includes the end date as a day.
Actual Daily Budget Spend - this is calculated on the total spent for the campaign (cost) divided by the number of days between the start date and today's date. This calculation includes the end date as a day.
Projected End Date - this displays the date the budget will end on if the campaign keeps burning at the rate of the Actual Daily Budget Spend. This is calculated in two steps:
Step 1 - the total budget divided by the Actual Daily Budget Spend gives the number of days the budget will be finished in based on how much is being spent daily at the moment
Step 2 - The number of days from Step 1 is then added to the Start Date of the campaign to give you the Projected End Date
InquiryDetails
Purpose
Find in depth information for inquiries in this tab of the report.
How to use / interpret
This tab provides all the details gathered for each individual lead/opportunity gathered for the campaign including: the sales stage the lead/opportunity has reached and the length of time that has elapsed since reaching the current sales stage, contact details, Cost Per Lead and Impression Per Lead to name a few.
Download data to excel
Validation Audit
Purpose
See stats for outcome of the validation process. These include: Inquiries awaiting validation, outcome of validation by validator, and volume of inquiries validated by month.
How to use / interpret
The validation audit tab tracks Content Syndication inquiries that require in-house validation. You will see the number of inquiries for in-house validation, the number of inquiries which have not been assigned to a validator and track the progress of inquiries by Validators.
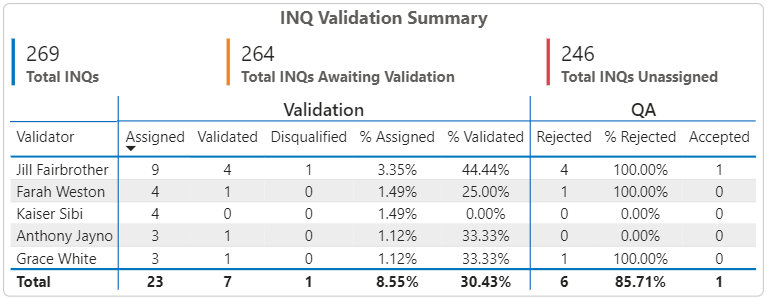
The INQ Validation Summary is a general summary of all content syndication leads that require in-house validation. At the top summary, there are 3 figures:
Total INQs - This is the total number of INQs that require in-house validation. This number is calculated based on the number of inquiries that have reached the 1. INQ - Validate stage of the process
Total INQs Awaiting Validation - Total number of INQs that are currently active at the 1. INQ - Validate stage and are waiting to be validated
Total INQs Unassigned - This is the total number of INQs that are currently active at the 1. INQ - Validate stage and a validator have yet to be assigned a Validator. A validator is assigned by populating the 'Validator' field on the 1. INQ - Validate WorkItem
Below 'Total INQs for Validation' and 'Total INQs Unassigned', we can see the breakdown of each 'Validator' and various performance metrics for each validator. By default inquiries are sorted by the Assigned number of INQs (highest at the top).
Validator - The person responsible for validating the inquiry. This is determined by the user selected in the 'Validator' field on the 1. INQ - Validate WorkItem
Assigned - The total number of Inquiries where the validator name is selected in the 'Validator' field
Validated - The total number of inquiries the validator has successfully validated. This is determined by the validator completing the 1. INQ - Validate WorkItem and the inquiry progressing down the funnel (QA or disqualified)
% Assigned - What proportion is the validator responsible for validating (out of all the inquiries that require in-house validation for the campaign)?
Calculation - Assigned / Total INQs for Validation
% Validated - What proportion has the validator completed successfully (out of all the inquiries the validator is responsible for validating)?
Calculation - Validated / Assigned
Rejected - The total number of inquiries passed to QA and were rejected
% Rejected - What proportion has QA rejected (out of all the inquiries the validator has passed to QA)? This metric helps determine the quality of validation
Accepted - The total number of inquiries passed to QA and the QA resource has accepted as a valid inquiry
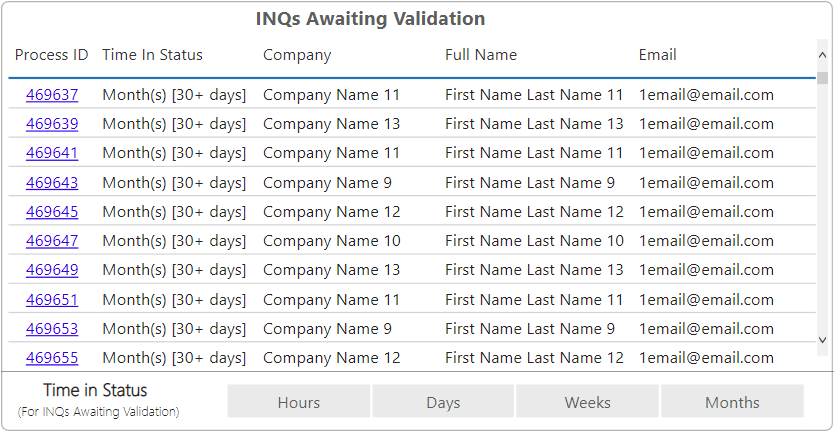
INQs Awaiting Validation
The INQs awaiting validation table displays all processes that are currently active at the 1. INQ - Validate stage and are waiting to be validated, this means that in the table you will also see QA rejects as the 1.Validate WorkItem is reactivated. The table contains 5 columns:
NOTE: Inquiries rejected by QA are returned to the Validator and will re appear in the INQs Awaiting Validation list
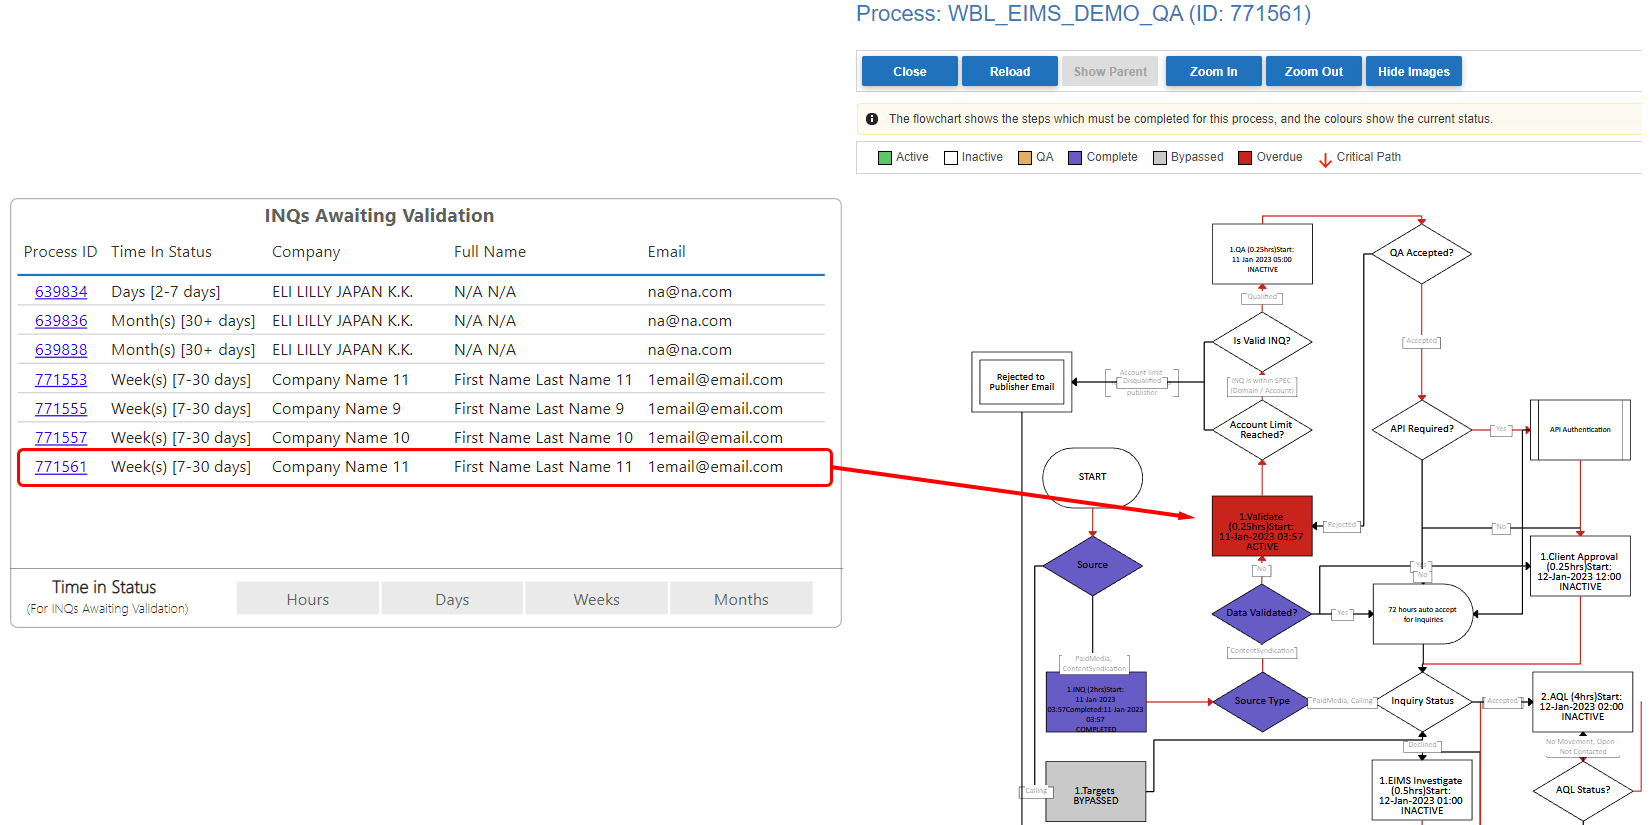
Process ID - The Id of the process in WMS. This column has a hyperlink that takes you to the process diagram of the selected process when clicked
Time In Status - How long the inquiry has been active at the 1. INQ - Validate stage. There are 4 categories the inquiry will fall into:
Hours [Under 48 hours]
Days [2-7 days]
Week(s) [7-30 days]
Month(s) [30+ days]
Company - Company of the contact
Full Name - Full Name of the contact
Email - Email of the contact
Below the table you will find a button for each Time in Status category. These filters apply only to this grid. Click a category once to filter the INQs Awaiting Validation table by the selected time scale.
TIP: Multiple categories can be selected by holding Ctrl and clicking each category to display simultaneously
Example 1 - New inquiry ready for validation
Example 2 - Inquiry rejected by QA
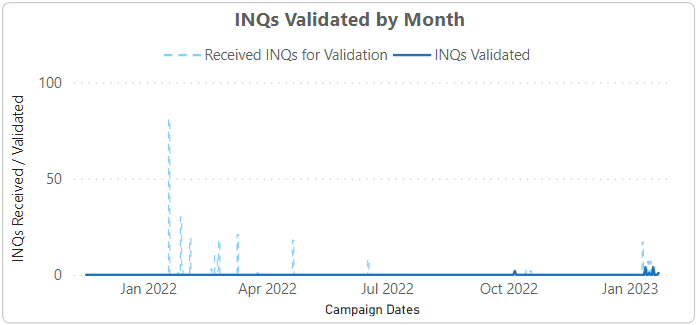
INQs Validated by Month
The INQs Validated by Month is a line graph showing the number of INQs received for validation and INQs validated over the course of the campaign. By default the graph shows data by month however, as the campaign date is filtered the date range will become more granular.
X-Axis- A date range starting from the campaign start date and ending with the projected end date (set in the campaign configuration found in the campaign dashboards module) or today's date if the campaign end date has not been met
Y-Axis- The line graph plots 2 metrics on the y-axis:
INQs Validated - The number of INQs successfully validated on a given date
Received INQs for Validation - The number of INQs that reached the 1. INQ - Validate stage on a given date
Page Filters
The page filters can be used to filter the 3 sections previously discussed on the validation audit page. The filters applied here will not impact on other tabs in the Campaign Funnel Report:
Campaign Dates - A date range filter that starts with the campaign start date and ends with the projected end date or today's date if the end date has not been reached. The campaign data filter applies to all visuals in the validation audit tab and filters by the activated date of the 1. Validate WorkItem
Campaign - A drop-down list of all the campaigns entered in the 'Campaign Name' field. The campaign filter applies to the Campaign Name field in the campaign process
Validators - Validators selectable in the 'Validator' field in the campaign process with the addition of 'Unassigned'. Unassigned will always appear first in the list with the rest sorted alphabetically (top - down, left - right)
You can clear all applied filters (this includes the reporting level filters) by clicking the clear filters button in the top right corner of the page filters section.
RMT [Lead follow-up Analysis]
Purpose
Review stats for outcome of the lead follow up process. These include: counts by campaign, disqualified reasons captured in the system, active leads and respective breakdown by owner and funnel stage.
How to use / interpret
The RMT tab breaks down all the active leads within a campaign by each stage of the sales funnel. This tab also includes a list of the agents who are allocated the leads in WMS.
Understanding the Numbers
Due to the many different types of marketing tactic the numbers in this report can often be misunderstood. Here’s a quick ‘cheat-sheet’ to understand the most important numbers.
Campaign Funnel
A.C.R
Actual Conversion Rate
The actual conversion rate from the previous stage to the current stage.
Example: AQL has an 85% ACR. This means that 85% of the INQs progressed to the AQL stage.
The benchmarked conversion rate from the previous stage to the current stage.
The BCR is defined in the funnel configuration with 6 different benchmark types.
The default benchmark type is the SOW Proposal (Targets) type. Changing the BenchmarkType filter will adjust the BCRs on the funnel.
Budget
The total amount of money allocated to the campaign. this is configured in the campaign setup and is broken down by SourceType and Region.
ECPM
Estimated Cost Per Mille
The current estimated cost per 1,000 impressions.
Calculation: (Cost / Impressions) * 1,000
Cost
The amount of money that has currently been spent on the campaign.
The cost is calculated based on the SourceType and combined to give the total cost:
PaidMedia Sum of the daily advertising spend.
ContentSyndication Each ContentSyndication Inquiry has an AgencyPlacementName that has a fixed Cost Per Lead. This is set in the funnel configuration.
The cost is the sum of the attributed Price Per Lead for each Inquiry that has progressed to the EIMS sales stage AQL.
Calling The sum of the cost value for each inquiry. This value is added at the bulk import stage.
IPC
Impressions Per Click
The number of impressions it takes to convert to a click. For example, 100 IPC means that for every click there were 100 impressions.
Calculation: Impressions / Clicks
Remaining
The amount of budget remaining.
Calculation: Budget - Cost
ECPC
Estimated Cost Per Click
The current estimated cost for a single click.
Calculation: Cost / Clicks
Cost Per
The current cost for a single land / lead for the relevant stage.
Calculation: Spend / Stage Count
Active
The number of leads that are active at the relevant funnel stage.
Disqualified
The number of leads that have been disqualified at the relevant stage.
Calculation for INQ: Suppressed + Declined by Client - EIMS Investigating
Value
The total value of all leads at the relevant stage.
All leads that have not reached the EIMS stage "SAL" have an average deal value. Once the lead reaches the SAL stage the value is taken from the "Value" field in the process.
Total Pipeline
The total value of leads that have converted to an opportunity (EIMS stage SQO)
ROI (E:R)
Return on Investment
Return On Investment or Return On Costs is a ratio between the value of the WON deals (WON Value) and the current amount spent on the campaign (Cost).
Calculation: (Won Value / Cost) * 100
Calculation for Channel: (Won Value / Budget) * 100
Considerations & Limitations
There are a few known issues with the Digital Campaign Funnel Report. These are visible to you in every report info icon, and are as follows:
1. InquiryDetails list contains all Ad click data, including clicks that have not been paid
2. Leads without a DigitalUniqueId do not have TOFU data. Filtering can cause the funnel to display misleading values if there is no link between the field(s) filtered and
the ad/lead data
3. Advert data (Impressions, clicks etc...) and lead data has a 24 hour delay between synchronisation. Meaning: Leads registered after 11:00am will not have ad data until
the next days ad synchronisation
4. Formula for ROI(E:R) % calculation = Won value divided by the cost value times 100 (Won Value /Cost*100)
5. The InquiryDetails tab data extract is limited to 150,000 rows. For a full data extract run the digital campaign report on the web platform
6. The date range filter on the "Custom Date Range" tab allows for any date values even if they do not exist in the underlying date column. However, the date range on the TOFU and BOFU grids will only reflect ranges between the campaign start and end date