menu

WebPlatform Documentation

EIMS Campaign Dashboards

Why have we created dashboards for EIMS Campaigns?

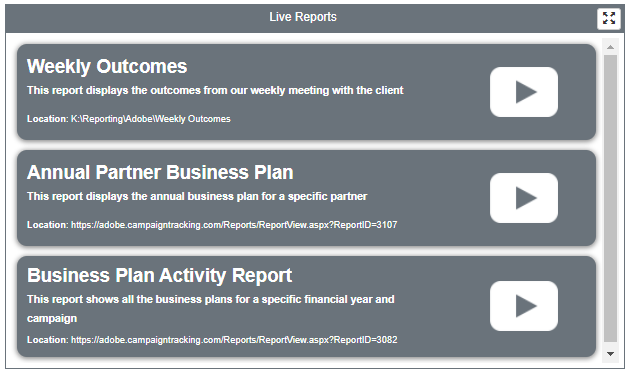
The purpose of a campaign dashboard is that it helps users who are involved in the campaign access all information such as the CBD, Signed SOW Document, Live Reports and any training content from a centralised location. It also allows new users coming into the campaign to quickly and easily access content for the campaign.

Summary

A non-digital EIMS Campaign Dashboard is a centralised location for all the resources in a given campaign. The dashboard is split into 6 tiles:

  • Campaign Briefing Document
  • Deal SOP Process
  • QBR Process
  • Campaign Setup Process
  • Live Reports
  • Other Resources

Using the dashboard

Tiles explained

Campaign Briefing Document

This tile displays two images, one stating Campaign Briefing Document and the other is of an SOW Document. Clicking on the first image will open up SharePoint Link to view the CBD. Clicking on the second image will download the relevant document for the campaign.

It is important to have these two documents in the dashboard as it provides a 'single source of truth' for the CBD and Signed SOW for a campaign.

Deal SOP Process

This tile displays the Deal SOP Process Diagram for the campaign, the importance of this tile on the dashboard is that it allows you visualise and understand the status of the Deal SOP for the campaign.

QBR Process

This tile displays the QBR Process Diagram for the campaign, the importance of this tile on the dashboard is that it allows you visualise and understand the status of the Quartely Review for the campaign.

Campaign Setup Process

This tile displays the New Campaign Setup Process Diagram for the campaign, the importance of this tile on the dashboard is that it allows you visualise and understand the status of where the Campaign Setup currently is for the campaign

Live Reports

This tile displays the reports which are used for the campaign.

The reports appear with the following information:

  • The name of the report
  • An explainer video detailing what the report is about
  • A description of the report
  • The location of the report so you know where you can access it from

The live reports tile is important to be displayed on the dashboard as it displays the reports which are currently being used for the campaign and with the explainer video it shows how to use these reports effectively. 


Other Resources

This tile displays any additional resources which are relevant to the campaign such as Training content and any additional campaign reports.

The training content outlines what the training content is and the location as to where it can be found

If there are any additional campaign reports these will be displayed with the following information:

  • The name of the report
  • An explainer video detailing what the report is about
  • A description of the report
  • The location of the report so you know where you can access it from

The Other Resources tile is important to be displayed on the dashboard as it contains all the relevant information in a single place and anyone can easily familiarise themselves with this campaign.

Explainer Videos from EIMS Users

EIMS users must supply explainer videos for the reports they have visible in their dashboards.

In most circumstances, the EIMS user will create the explainer video and save it on in the campaign folder in the EIMS network.

LMS will take your video and upload it into a youtube EIMS Training account and link it to the campaign dashboard.

EIMS - Campaign Dashboards : The complete end to end set up experience

help_outline
close