Overview tab
The overview tab gives a summary of the key fields and how the data has changed for the campaign. Below are the metrics measured and what they mean:
| Metric |
Description |
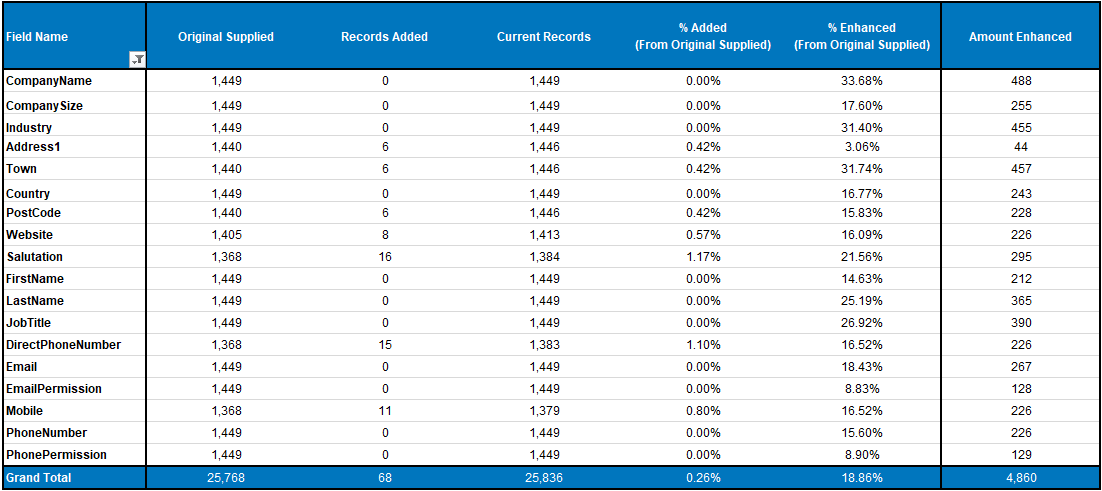
| Original Supplied |
The number of data elements for a given field EIMS loaded for all projects. E.g. the number of Inquiries where the field value was supplied from the start. |
| Records Added |
The number of data elements that do not have a originally supplied value and a value has since been added. E.g. the number of Inquiries where the field values was not supplied from the start but has been added at a later date. |
| Current Records |
This is the number of data elements that were in the database for a given field. E.g. The number of Inquiries where the field currently has a value. |
% Added
(From Original Supplied) |
The Amount Added divided by the Original Supplied. |
% Enhanced
(From Original Supplied) |
The Amount Enhanced divided by the Original Supplied. |
| Amount Enhanced |
The number of data elements that have been edited and thus changed from the Original Supplied. E.g. the number of Inquiries where the field value was supplied from the start and has sinced changed to a new value. |
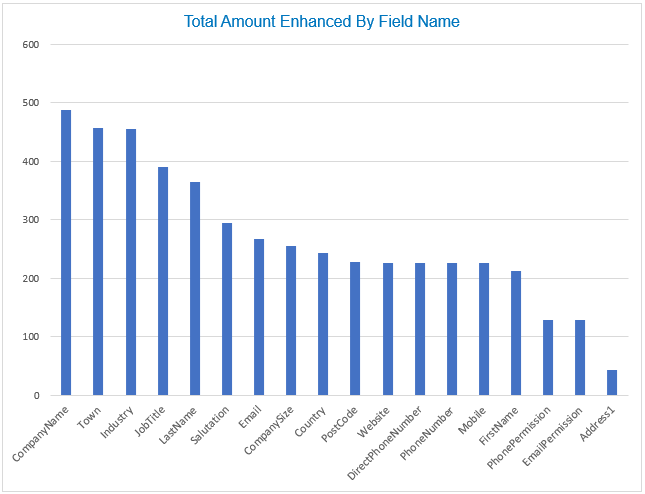
To the right hand side of the summary is a bar graph ordered by the field with the most amount of enhanced Inquiries:
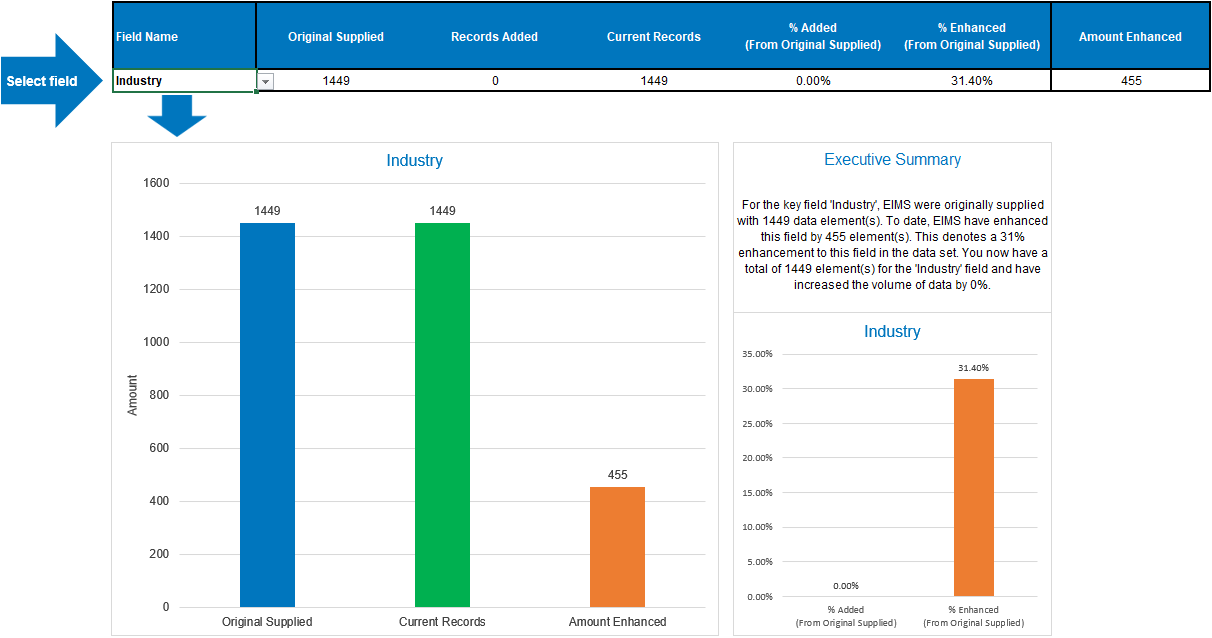
Below the field enhancements table is a single row table. You can select one of the key fields from a dropdown by clicking the cell (B31). A dropdown button will appear on the right hand side of the cell, click the button and select the desired key field from the list:
The table reflects the same data from the summary above for the selected field. This data is then used for a set of graphs and an executive summary.
The graph on the left hand side shows the total original supplied, current records, and amount enhanced for the selected field. To the right of the graph is the executive summary along with a second graph that shows the % added and % enhanced for the selected field: