menu

WebPlatform Documentation

Activity Audit Report including (CPL)

Summary

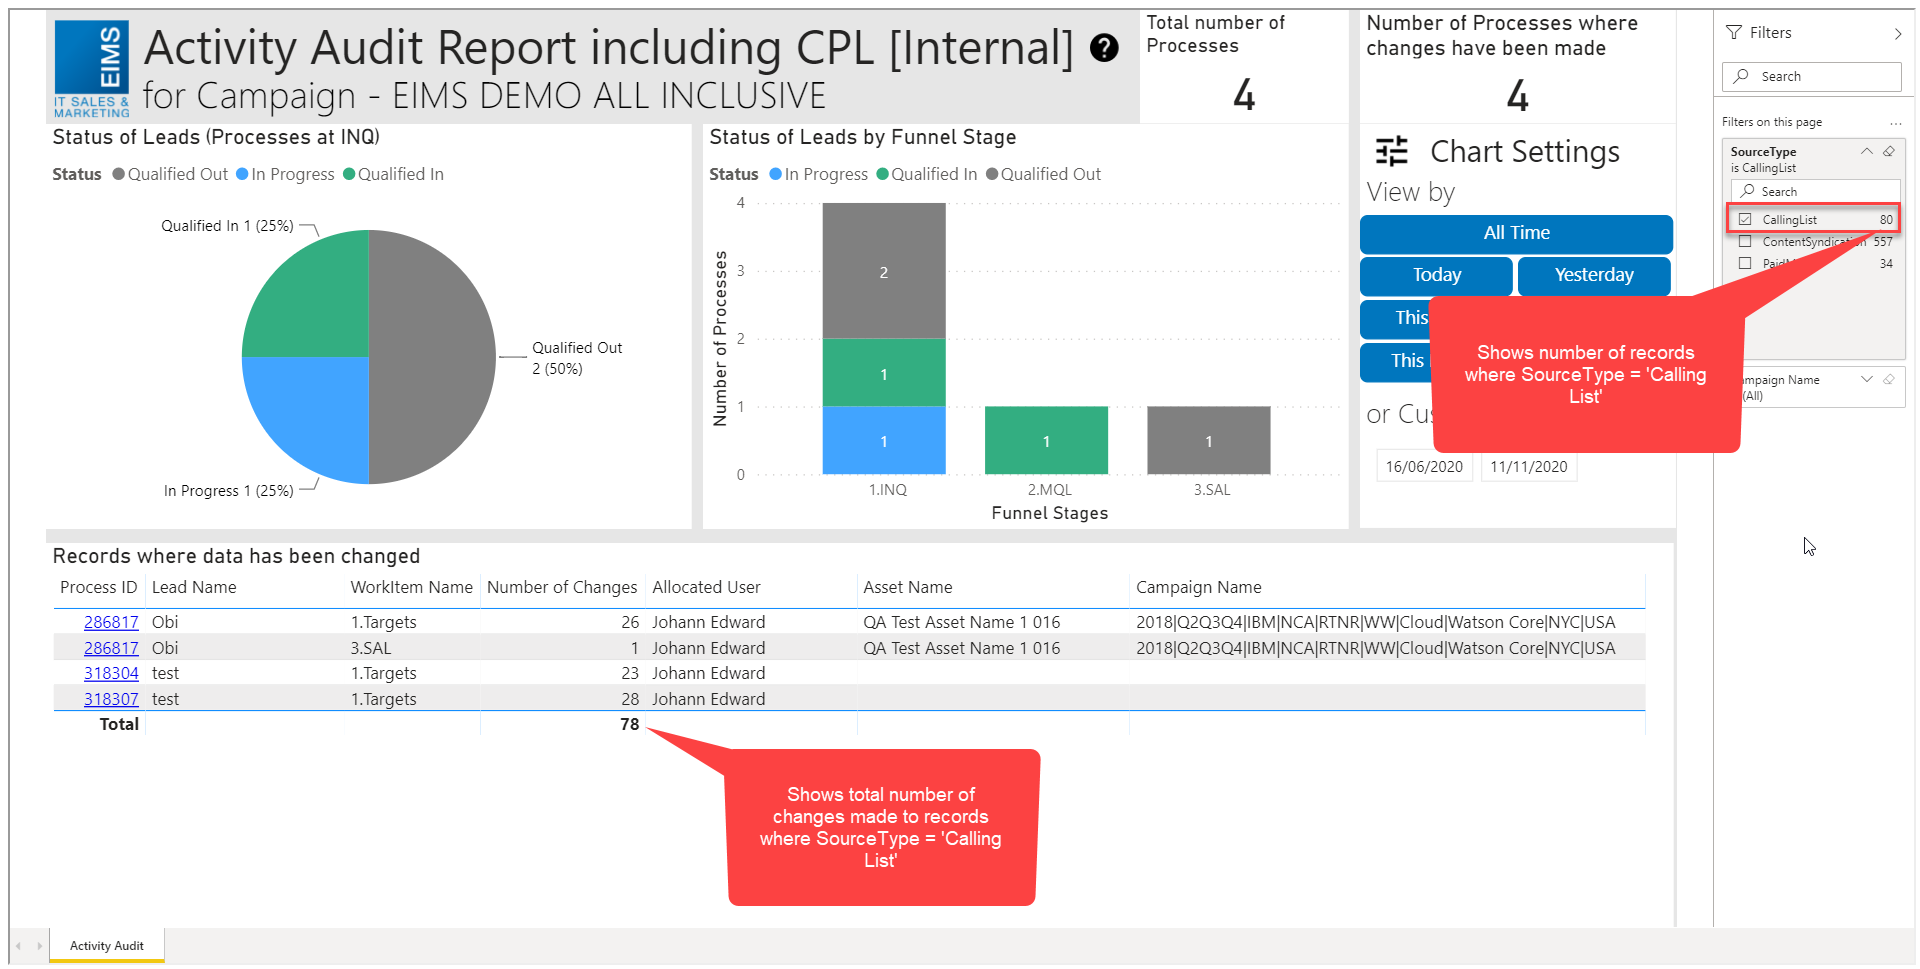
This report displays the number of changes made to WorkItems and the qualification status of leads in a campaign.

The report shows all activity for all WorkItems in the Process so we can see this all in one report, this includes activities for Cold Calling leads, Content Syndication and Paid Media

The dashboard in both cases displays the qualifications of leads for a single campaign and how many of the leads has been changed before either being Qualified In or Qualified Out.

Date Filter

The date filters change the range of WorkItems displayed in the report and filters by the Timestamp of changes made to a WorkItem. By default the report displays all WorkItems however, you can change this by either clicking 1 of the buttons or using the slider at the bottom of the panel, the pre-set filters are:

  • All time - Displays all Completed WorkItems
  • Today & Yesterday - Filters the list to display the WorkItems completed in the current calendar day or the previous calendar day
  • This Week & Last Week - Filters the list to display the WorkItems completed in the current week and the previous week
  • This Month & Last Month - Filters the list to display the WorkItems in the current calendar month or the previous calendar month

Source Type & Campaign Name Filter

The data in the report can also be filtered by Source Type and Campaign Name which are visible on the right hand panel of the report. If you filter by these two fields, the charts will update based on the value selected. By default the report displays all leads for the Campaign by all Source Types

Numbers are displayed next to the filter options in the right hand panel. These numbers represent the numbers of rows for that specific Source Type or Campaign in the data. You may notice that when selecting the filter source type = 'Paid Media' you see the number 34 next to the filter option but in the grid where records have been changed it only shows 32. The reason for this is because the numbers in the filter show all the records whether there has been a change made or not and the numbers in the table only show numbers for where records have been changed.

Pie Chart: Status of Leads (Processes at INQ)

This shows the qualification status of leads. The pie is broken down by:

  • In progress - this is where the 'Inquiry Status' has not been set yet and the answer to the 'Is Valid Inquiry' field is not set to Disqualified
  • Qualified In - this is where the 'Inquiry Status'  is set to Qualified
  • Qualified Out - this is where the 'Inquiry Status' OR  the 'Is Valid Inquiry' field is set to Disqualified

If you right click on a section of the pie, select the drill through option and select 'Activity Details' you can view the processes, WorkItems and any changes which have been made to fields for that Qualification Status.

If you click on a portion of the pie chart, the other visuals on the page will filter based on the relevant portion of the pie selected.

Stacked Bar Chart: Status of Leads by Sales Stage

This shows the distribution of leads per Sales Stage. The bar for each Sales Stage is broken down by leads which are:

  • In progress - this is where the current Active WorkItem for a Process is at that Sales Stage
  • Qualified In - this is where the lead has been Qualified at that Sales Stage 
  • Qualified Out - this is where the lead has been Disqualified at that Sales Stage

By right clicking on a section of the bar, selecting the drill through option and selecting 'Activity Details' you can view more information of the status of leads for the lead.  If you click on a portion of the bar chart, the other visuals on the page will filter based on the relevant portion of the bar selected.

Grid at the bottom of the page: Records where data has been changed

The grid shows all WorkItems where data has been enriched (changes made to the fields) in the Process. This means that the grid will not WorkItems in Processes where a user has not made any changes.

See below details of each column in the grid:

  • Process ID - The ID of the process. Each ID has a hyperlink to the process diagram
  • Lead Name - The Company Name for the Process
  • WorkItem Name - The WorkItem which is either Active or Completed in the Process
  • Number of Changes - The total number of changes made to the WorkItem
  • Allocated User - The user who was allocated the WorkItem
  • Asset Name - The Asset Name for the Process - provided by the publisher
  • Campaign Name - The Campaign Name for the Process - provided by the publisher

Drill through tab: Details of Activity   

When drilling through from the chart you will be taken to the Details of Activity page.

At the top of the page you will see the total number of Processes, WorkItems and the number of changes made to Context Objects displayed in the grid.

In the grid you will see the Process and WorkItem Information such as the allocated user, which WorkItem was updated, the current Active WorkItem (if there are any) and Context Objects which have been updated. You will see the Context Object Name, the previous value, the new value and when the change was made (the timestamp).

You can return to the Summary tab by clicking on the 'Back to Activity Audit' at the top of the page.


help_outline
close